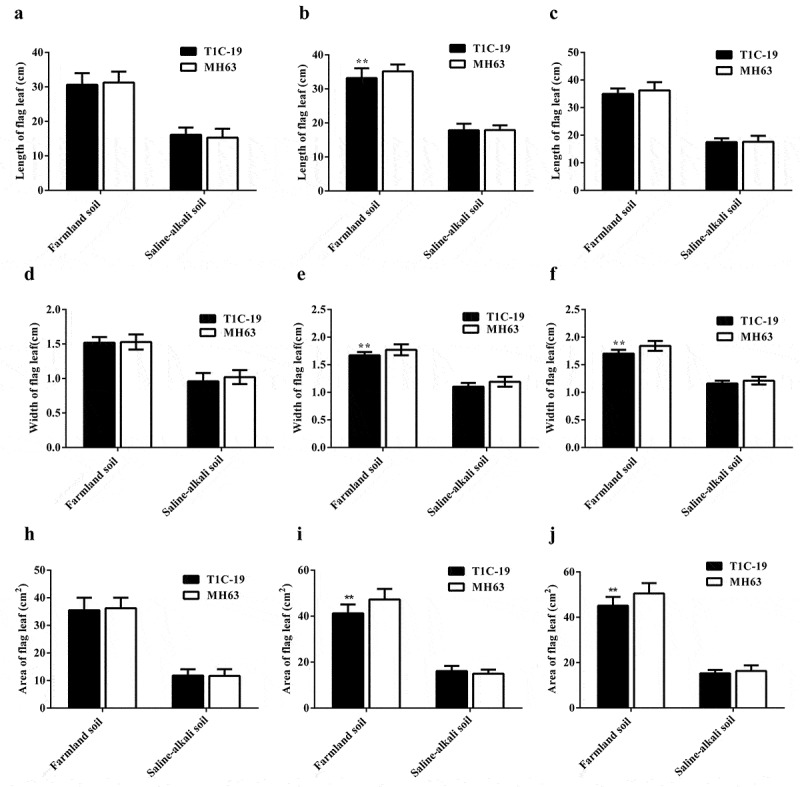
Figure 4.

Flag leaf length (mean ± SEM), width (mean ± SEM), and area index (mean ± SEM) of T1C-19 and MH63 rice grown in farmland and saline-alkaline soils. (a,d,h). Heading stage; (b,e,i). Filling stage; (c,f,j). Maturing stage. The values of T1C-19 rice with ** were significantly different from those of MH63 rice according to the t-test (P < .01).
