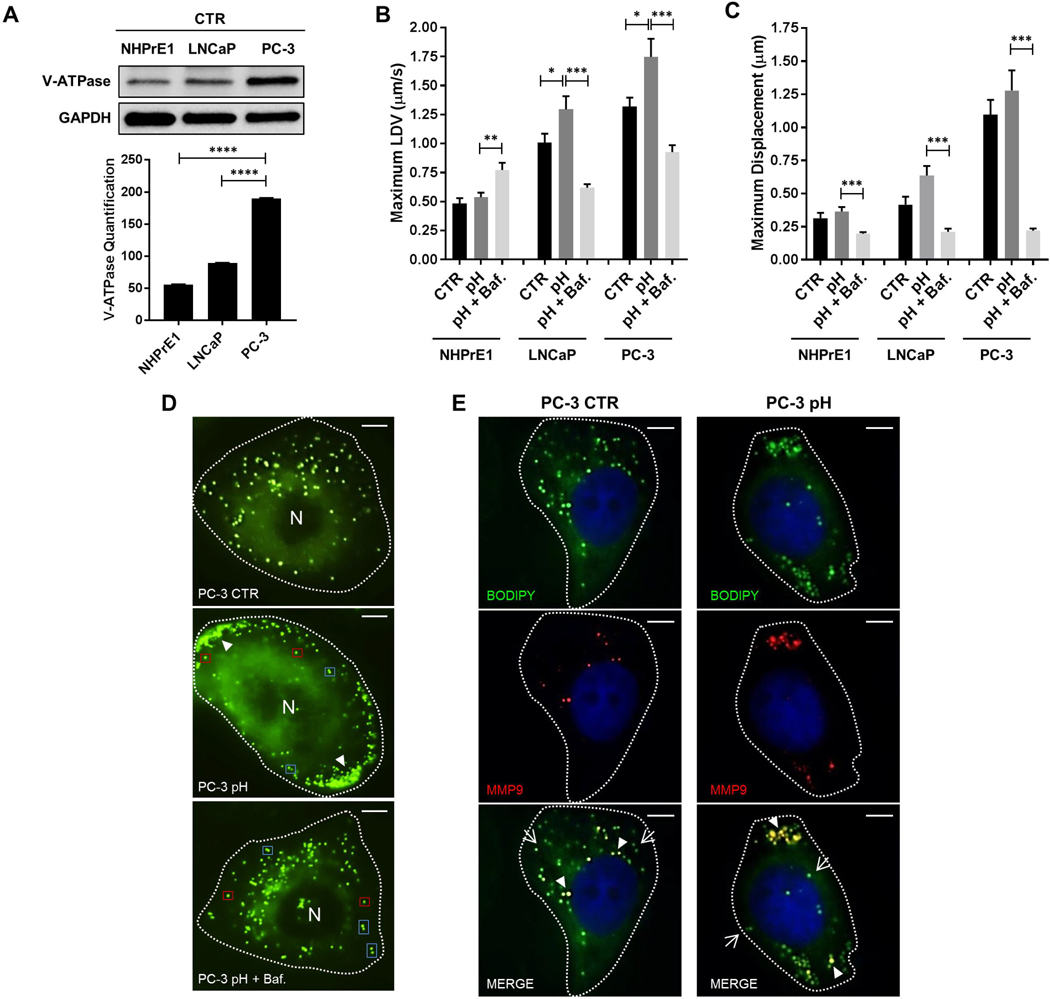
Figure 4. LD movement and localization are dependent on V-ATPase in prostate cancer cells.
(A) V-ATPase (ATP6V1E1) (26 kD) levels were analyzed by western blot in NHPrE1, LNCaP, and PC-3 cells and normalized by GAPDH (37 kD). NHPrE1, LNCaP and PC-3 cells were treated with 7.1 nM HCl with or without 1 nM Bafilomycin A1 (Baf.) and (B) LDVmax and (C) Dmax were measured and compared to the controls (CTR). (D) LDs were stained with BODIPY (green) in PC-3 cells control and treated with 7.1 nM HCl with or without 1 nM Bafilomycin A1 (PC-3 pH and PC-3 pH + Baf. A1) in order to analyze their intracellular localization (arrowhaeds: LD clusters; red boxes: single LDs; blue box: double LDs). Scale bars: 10 μm. (E) PC-3 cells control (PC-3 CTR) and treated with 7.1 nM HCl (PC-3 pH) were stained with anti-MMP-9 antibody (red) and BODIPY (green) in order to visualize the intracellular localization of MMP-9 protein and LDs (arrow: LD without MMP-9; arrowheads: co-localization between LD and MMP-9). Scale bars: 10 μm. n=50. Values are mean ± SEM. Student’s unpaired t-test. *P<0.05, **P<0.01, ***P<0.001, ****P<0.0001.

