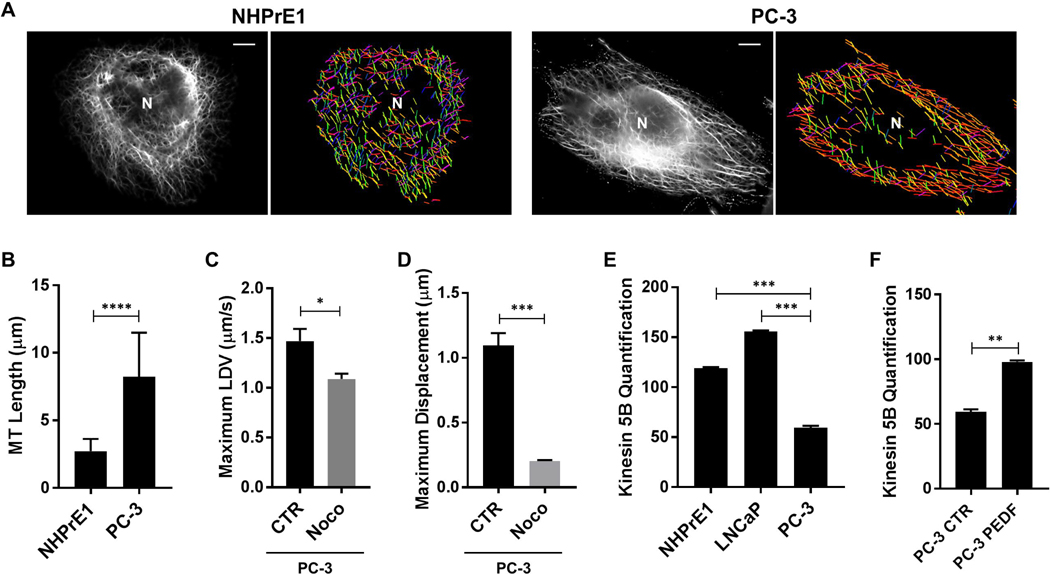
Figure 5. MT architecture of PCa cells reveals longer MTs with directionality.
(A) In NHPrE1 and PC-3 cells, MTs were stained with α-tubulin (black and white channel) and a MT filament analyzer was used to reconstruct the length and directionality (different colors) of the MTs. Scale bars: 10 μm. (B) The MT length (μm) was measured in aggressive PC-3 cells and compared to NHPrE1 cells. n=50. Aggressive PC-3 cells were treated with 5 μM Nocodazole (Noco) for 4 h and (C) LDVmax and (D) Dmax were measured and compared to the controls (CTR). (E) Kinesin 5B levels were quantified in NHPrE1, LNCaP, and PC-3 cells after normalization by GAPDH. (F) Kinesin 5B levels were quantified in PC-3 control (CTR) and PC-3 treated with PEDF after normalization by GAPDH. Values are mean ± SEM. Student’s unpaired t-test. *P<0.05, **P<0.01, ***P<0.001, ****P<0.0001.

