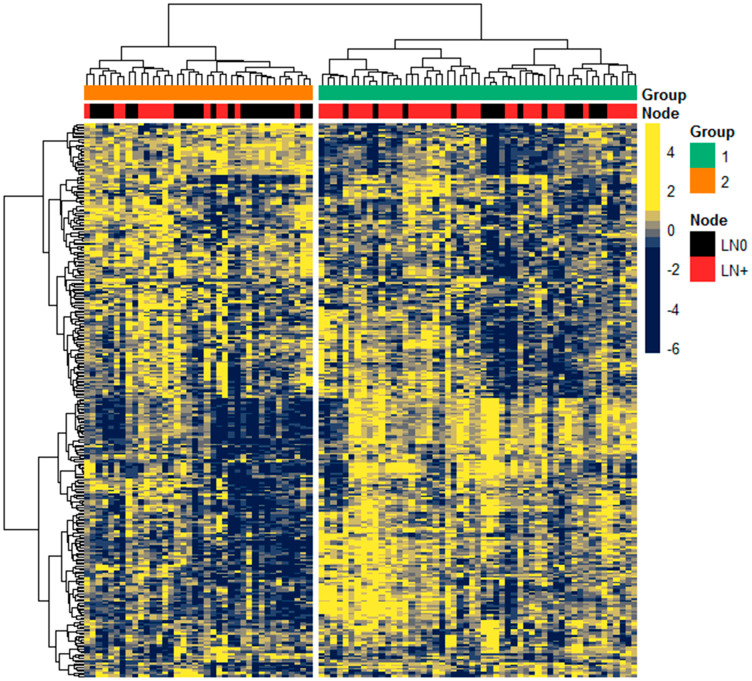
Figure 1. Expression of miRNA in Discovery cohort.
Unsupervised hierarchical clustering of 301 miRNAs expression (scaled z-score) among the 91 patients, with Pearson correlation and Euclidean as distance measures for clustering the columns and rows, respectively. Top colored bars annotate the clustered groups derived from k-means clustering (k = 2) and LN status as either LN0 (black) or LN+ (red).

