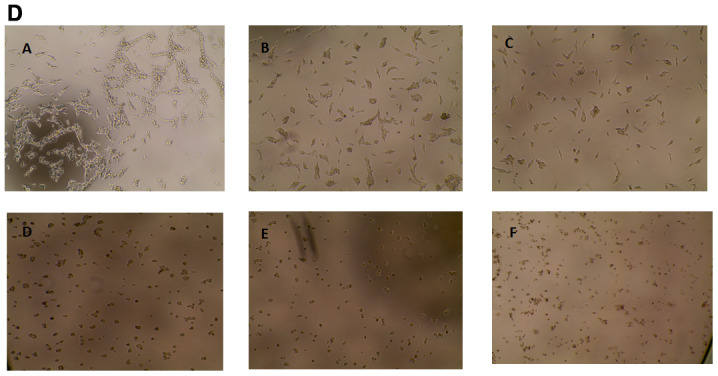
Figure 1. Cytotoxicity of FEO on B16-F10, FM94 and HNEM cells.
(D) FM94 cells treated with FEO (A-Untreated cells; B-3 μg/ml; C-5 μg/ml; D-7 μg/ml; E-10 μg/ml; F- Dox 5 ug/ml) for 24 h and morphological image was photographed by EVOS image analyser; E: HNEM cells treated with FEO (A-Untreated cells; B-3 μg/ml; C-5 μg/ml; D-7 μg/ml; E-10 μg/ml; F- Dox 5 ug/ml) for 24 h and morphological image was photographed by EVOS image analyser. Data presented as mean ± SD of triplicates of three independent experiments. *Represents significant difference at p < 0.05 compared with control. **Represents significant difference at p < 0.01 compared with control. ***Represents significant difference at p < 0.001 compared with control. NS: Non significant. Scale bar indicates 10 um.

