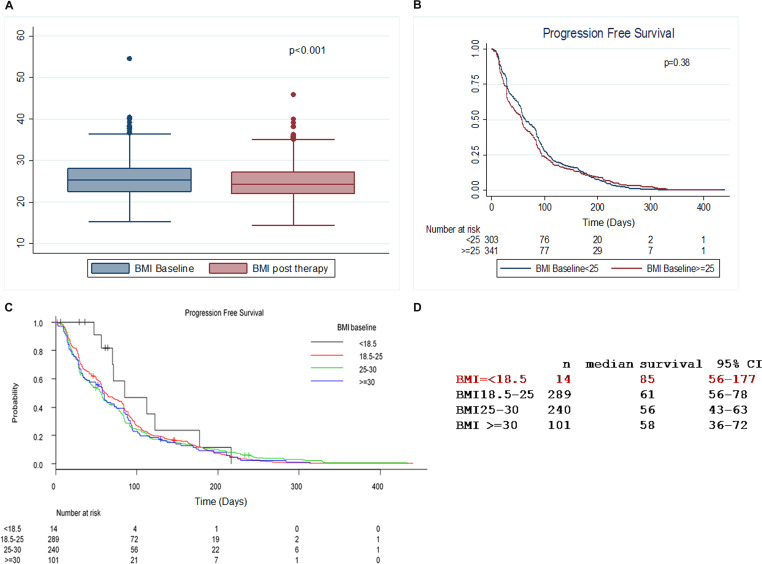
Figure 1. BMI changes during treatment with everolimus.
(A) Statistically significant decrease in BMI at the end of therapy (EOT) in comparison to the baseline values. (B) Correlation between BMI values at baseline and progression-free survival (PFS). (C) Patients were stratified in 4 classes according to BMI values at baseline. Patients with BMI ≤ 18.5 Kg/m2 tend to show increased PFS (p = 0.45). Of note, only 14 patients have a BMI ≤ 18.5 Kg/m2 at baseline. (D) Median survival table in patients stratified in 4 classes according to BMI values at baseline.

