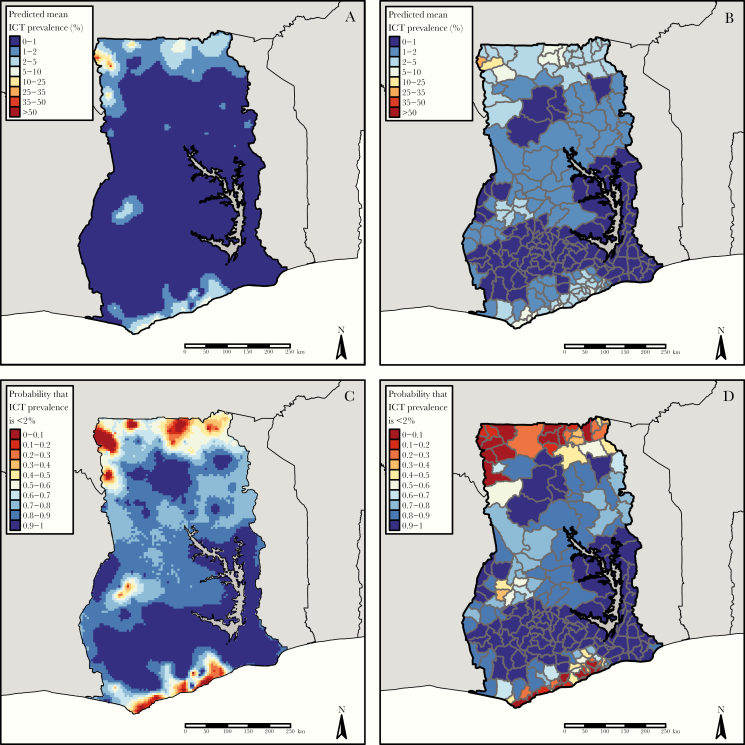
Figure 1.
A, Predicted mean immunochromatographic test (ICT) prevalence at 5-km pixel level. B, Predicted mean population weighted ICT prevalence at the evaluation unit (EU) level. C, D, Probability maps for nonexceedance of 2% prevalence at pixel level (C) and nonexceedance of 2% population-weighted ICT prevalence at EU level (D).

