FIG 3.
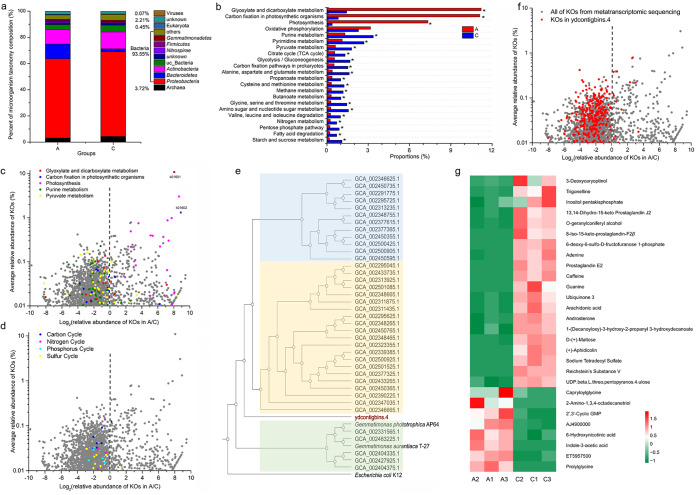
Omics analyses of bacterial functions in bare and vegetative wetlands. (a) Relative abundances of microorganisms (bacteria, archaea, eukaryotes, and viruses) in plots A and C based on metagenomic sequencing. (b) The relative abundances of metabolic pathways of plots A and C at KEGG level 3 based on metatranscriptomic sequencing. Each asterisk (*) indicates a fold change value of >2. (c) Volcano plots of the metatranscriptomics-identified genes associated with the main metabolic pathways in plots A and C. (d) Volcano plots of the metatranscriptomics-identified genes associated with the cycling of elements in plots A and C. (e) A phylogenomic tree of MAGs and cultured genomes of the phylum Gemmatimonadetes. (f) Expression patterns of the genes from ydcontigbins.4 in the metatranscriptome. (g) Heat map of the 28 differentially enriched metabolites in the samples of plots A and C using Z-scores [Z = (X − average)/standard deviation].

