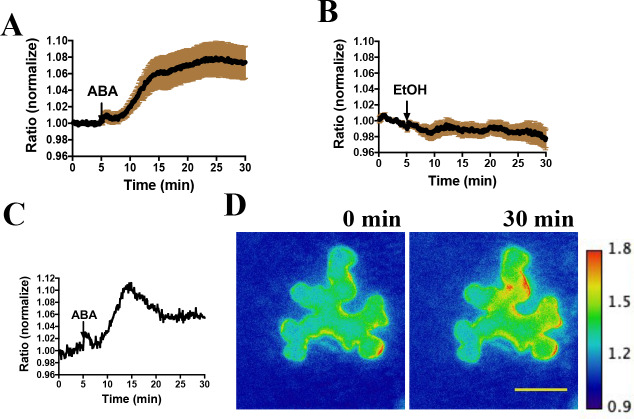
Figure 2. Abscisic acid induces increases in the ratio of YPet to Turquoise GL fluorescence emission of the SNACS reporter in N. benthamiana.
(A) Time-resolved FRET ratio changes in response to ABA. SNACS was co-infiltrated with pUBQ10:OST1-HF in N. benthamiana. Leaf epidermises were perfused with assay buffer (5 mM KCl, 50 µM CaCl2, 10 mM MES-Tris, pH 5.6) and then 20 µM ABA was added as indicated by the arrow. Experiments were repeated at least three times with similar results. FRET efficiency changes were recorded by measuring the ratio of fluorescence emissions at 535 nm/480 nm with an excitation wavelength of 434 nm (see Materials and methods). Data are averages of normalized emission ratios of YPet to Turquoise GL emission produced by exciting Turquoise GL from 11 cells. Error bars denote mean ± SEM. (B) Time-resolved FRET ratio in response to 0.02% EtOH (solvent control for ABA). Data are averages of normalized emission ratios from 7 cells. Error bars denote mean ± SEM. (C) and (D) Example of a single cell experiment from A. (C) The corresponding emission ratio normalized to the average value over 5 min before treatment. (D) Pseudo-colored fluorescence ratio images of SNACS-expressing N. benthamiana leaf epidermal cells at times 0 min and 30 min. The calibration bar to the right of (D) indicates the numerical ratio (non-normalized) scale corresponding to the heat map. Bar = 50 µm.


