Figure 3. In vivo response of SNACS reporter of SnRK2 activity in response to ABA in Arabidopsis guard cells.
(A) Time-resolved FRET ratio changes in response to ABA (20 µM). FRET efficiency changes were recorded by measuring the ratio of fluorescence emissions at 535 nm/480 nm with an excitation wavelength of 434 nm (see Materials and methods). (B) Time-resolved FRET ratio change in response to EtOH (0.02%, solvent control for ABA). (C to E) Images of SNACS fluorescence ratios in guard cells from A at 0 min, 10 min and 15 min. The colored circles indicate the regions of interest (ROIs) used to measure fluorescence emissions with the colors corresponding to the blue and red traces in panel A. ‘1’ and ‘2’ in (C) denote ‘stomate_1’ and ‘stomate_2’, respectively. The calibration bar in the lower right of (E) indicates the numerical scale corresponding to the non-normalized heat map. Bar = 20 µm. Note that the lowest cell (red spot) in the images shows fluorescence of a single guard cell from an apparent half stomate. Treatments were performed blinded (ABA or EtOH). SNACS FRET activities in guard cells in leaf epidermises were analyzed in a pUBQ10:OST1-HF-expressing ost1-3 genetic background (Waadt et al., 2015). The ratio of YPet to Turquoise GL emission was normalized to the average value over 5 min before treatment.
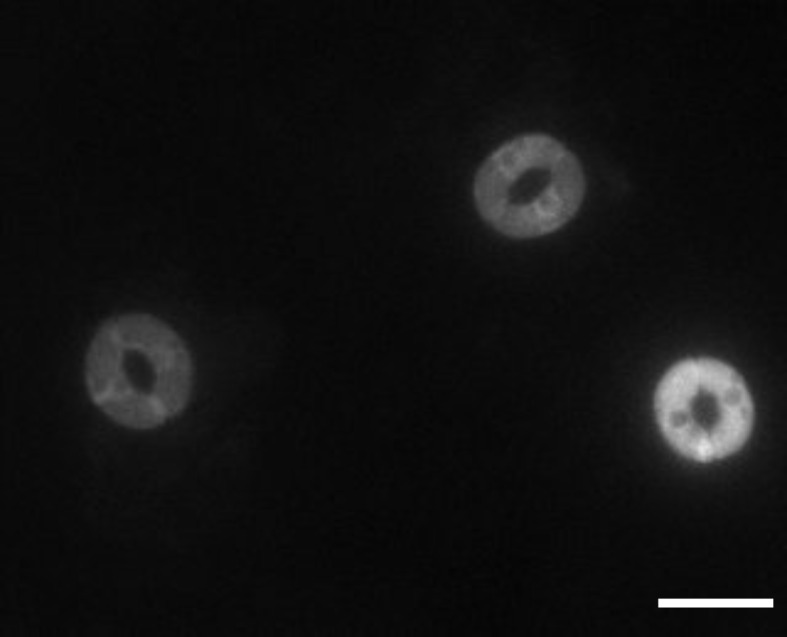
Figure 3—figure supplement 1. SNACS fluorescence appears to be observed mainly in the cytoplasm, with possible low expression in the nucleus or fluorescence may ‘bleed’ from the cytoplasm towards the nuclear region.


