. 2020 May 28;9:e56351. doi: 10.7554/eLife.56351

Figure 6. Effects of kinase inhibitors on SNACS fluorescence emission ratios in guard cells.

SNACS responses in guard cells were analyzed in the pUBQ10:OST1-HF-expressed in the ost1-3 genetic background. The ratio of YPet to Turquoise GL emission was normalized to the average value over the 5 min before K252a application. (A) The protein kinase inhibitor K-252a reduced SNACS FRET ratio in vivo, and ABA did not induce a ratio increase in the presence of K-252a. After 10 min incubation with 10 µM K-252a, 20 µM ABA was added. (B) ABA induced a ratio increase in the presence of DMSO (0.2%, solvent control for K-252a). (C) The kinase inhibitor K-252a inhibited SnRK2 kinase activity after ABA treatment. (D) Control experiment for C. 0.2% DMSO was added. (E) Kinase inhibitor W7 did not affect SNACS FRET ratio in vivo. After 10 min incubation with 20 µM W7, 20 µM ABA was added. (F) Control experiment for E. 0.1% DMSO was added as solvent for W7.

Figure 6—source data 1. SNACS FRET ratio values from each stomate in Figure 6.
elife-56351-fig6-data1.xlsx (128.9KB, xlsx)

Figure 6.

Figure 6—figure supplement 1. W-7 does not have a clear effect on ABA-induced OST1/SnRK2.6 activation in plant cells.
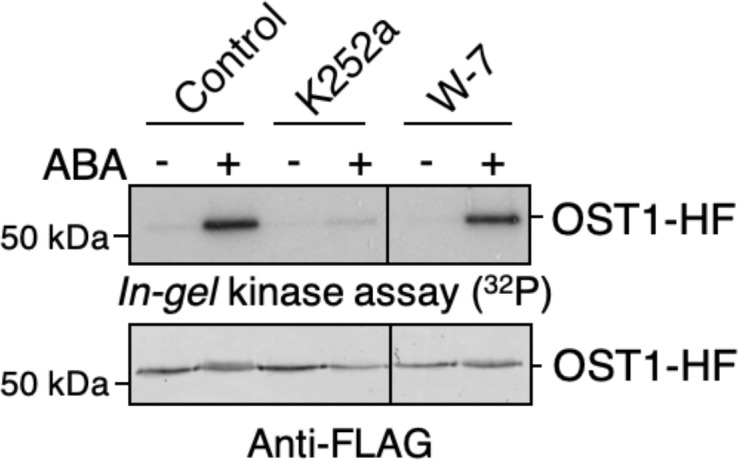
Figure 6—figure supplement 1.

Mesophyll cell protoplasts prepared from stable transgenic UBQ10:OST1-HF/ost1-3 Arabidopsis plants were incubated with 10 µM K252a, 50 µM W-7, or DMSO (control) for 20 min. Then, protoplasts were further incubated with or without 20 µM ABA for 15 min. In-gel kinase assays show OST1/SnRK2.6 kinase activities (top panel). OST1-HF protein amounts are shown by immuno-blots using anti FLAG antibody (bottom panel).
Figure 6—figure supplement 1—source data 1. Uncropped gel images for Figure 6—figure supplement 1.
Figure 6—figure supplement 2. Combined and averages of single stomate imaging data from experimental sets including experiments in Figure 6.

Figure 6—figure supplement 2.

Red lines show the average ratio changes of all stomata traces. Grey lines denote each single stomate ratio change. For visualization of individual stomate time courses see colored traces in Figure 6. Additional data from independent experimental data sets are included in several panels of Figure 4—figure supplement 2, Figure 6—figure supplement 2, Figure 7—figure supplement 1 and Figure 8—figure supplement 1 as indicated by the total number of stomata analyzed in Supplementary Figure legends. (A) n = 22 stomata, including the data shown in Figure 6A. (B) n = 19 stomata, including the data shown in Figure 6B. (C) n = 17 stomata, including the data shown in Figure 6C. (D) n = 15 stomata, including the data shown in Figure 6D. (E) n = 19 stomata, including the data shown in Figure 6E. (F) n = 9 stomata, including the data shown in Figure 6F.
Figure 6—figure supplement 2—source data 1. SNACS FRET ratio values from each stomate in Figure 6—figure supplement 2.