. 2020 May 28;9:e56351. doi: 10.7554/eLife.56351

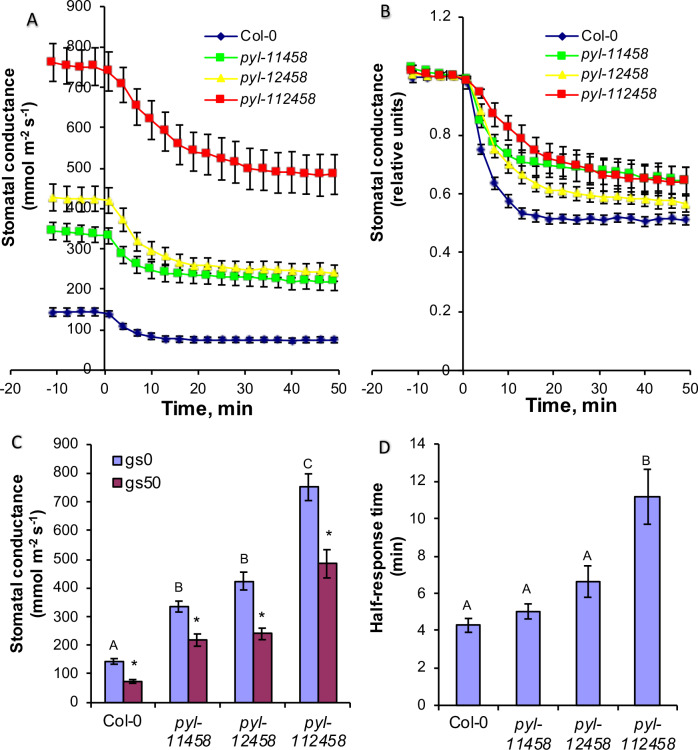
Figure 9. CO2 elevation causes robust stomatal closing responses in two ABA receptor quintuple mutant and in ABA receptor sextuple mutant plants.

(A, B) Time-resolved stomatal conductances of PYR/RCAR receptor quintuple (pyl-11458 and pyl-12458) and sextuple (pyl-112458) mutants. Air CO2 concentration was increased from 400 ppm to 800 ppm at the zero timepoints. Gas exchange analyses are from n = 5 to 7 whole plants per genotype and condition, using methods described in Merilo et al., 2018 (see Materials and methods). Data are presented in absolute (A) and relative (B) units. (C) Stomatal conductances before (gs0) and 50 min (gs50) after changing CO2 from 400 ppm to 800 ppm, average and SE (n = 5 to 7 whole plants). Capital letters denote differences in gs0 (pre-treatment stomatal conductance) between the lines (n = 5 to 7 whole plants, ANOVA, p=0.000000), whereas stars denote whether gs50 is significantly different from gs0 of that line (n = 5 to 7 whole plants, ANOVA, p=0.00001). (D) Half-response times of stomatal closures in response to 50 min CO2 enrichment. Capital letters denote significant differences between the lines (n = 5 to 7 whole plants, ANOVA, p=0.000023).

Figure 9—source data 1. Stomatal conductance values of individual plants and half response times.

Figure 9.

Figure 9—figure supplement 1. PYR/RCAR ABA receptor pyr1 pyl2/4/5/8 quintuple mutant (pyl-12458) and pyr1 pyl1/2/4/5/8 (pyl-112458) sextuple mutant show larger absolute stomatal closing responses during the first 20 min under elevated CO2 compared to wild-type (Col-0) (light blue bars).

Figure 9—figure supplement 1.

Changes in stomatal conductance (gs) after the first 20 min CO2 elevation (gs20) in absolute units (left Y axis scale mmol m−2 s−1) and relative units (right Y axis scale in %: (gs0-gs20)/gs0). gs0 = steady state stomatal conductances prior to CO2 elevation. In absolute units, pyrpyl sextuple mutant stomata close the most (light blue bars: pyl-112458). In contrast, in normalized units, the pyrpyl sextuple appears to close stomata the least compared to wild-type (dark purple bars), high-lighting pitfalls of gs normalization. Capital letters show differences in absolute responses (p=0.000158), whereas lower case letters in relative responses (p=0.00158; ANOVA, generalized linear model and Tukey post-hoc).
Figure 9—figure supplement 1—source data 1. Absolute and relative changes in stomatal conductance values used in Figure 9—figure supplement 1.
Figure 9—figure supplement 2. Stomata of ABA receptor quintuple mutant (pyr1/pyl1/pyl4/pyl5/pyl8) and guard cell-targeted (B) PYL1 and (C) PYL4 ABA receptor complemented plants show stomatal CO2 responses similar to wild-type (Col-0) controls.

Figure 9—figure supplement 2.

Time-resolved stomatal conductance responses to changes in light and CO2 concentration in Col-0 (WT; A–D). (A) pyr1/pyl1/pyl4/pyl5/pyl8 quintuple mutant (pyl-11458). (B) pyr1/pyl1/pyl4/pyl5/pyl8/pGC1::PYL1 (pyl-11458/PYL1). (C) pyr1/pyl1/pyl4/pyl5/pyl8/pGC1::PYL4 (pyl-11458/PYL4). (D) pyr1/pyl1/pyl4/pyl5/pyl8/pGC1::PYL5 (pyl-11458/PYL5). Gas exchange experiments of intact leaves commenced under dark treatment and then leaves were exposed to 125 µmol m−2s−1 continuous light as indicated by arrow in each panel. CO2 concentrations are shown on top of the data traces in each panel. Note that WT traces in A to D are the same for comparisons, as the indicated genotypes were measured within the same experiments. Note that steady state stomatal conductance levels in pyl-11458 mutants are conditional. Data represent mean of stomatal conductances ± sem. WT (n = 4), pyl-11458 quintuple (n = 4), pyl-11458/PYL1 (n = 4), pyl-11458/PYL4 (n = 5), and pyl-11458/PYL5 (n = 4).
Figure 9—figure supplement 2—source data 1. Stomatal conductance values of individual plants used in Figure 9—figure supplement 2.
Figure 9—figure supplement 3. Genotyping of ABA receptor multiple mutants and guard cell-targeted ABA receptor complemented plants.

Figure 9—figure supplement 3.

(A) Col-0 (WT) and ABA receptor higher-order mutants were confirmed by primers targeting WT or mutant alleles. Primer pairs: PYR1 (PYR1-F + PYR1-R), PYL1 (PYL1-F + PYL1-R), PYL1 mutant (PYL1-F + LBb1.3), PYL2 (PYL2-F+ PYL2-R), PYL2 mutant (PYL2-F + DS5O), PYL4 (PYL3-F+ PYL4-R), PYL4 mutant (PYL4-F + LB3), PYL5 (PYL5-LP+ PYL5-RP), PYL5 mutant (PYL5-RP + dSpm1), PYL8 (PYL8-F+ PYL8-R), PYL8 mutant (PYL8-F + LB3). (B) Sequence results of PYR1 in WT and pyr1-1 (Q169*) mutant allele in ABA receptor higher-order mutants. (C) Confirmation of pGC1::PYL1, pGC1::PYL4, and pGC1::PYL5 transgenes in corresponding transgenic lines, pyl-11458/PYL1, pyl-11458/PYL4, and pyl-11458/PYL5. PCR reactions were performed using pGC1-F paired with PYL1-R, PYL4-R, or PYL5-R to amplify transgenes. Primer sequences are listed in Supplementary file 2.