. 2020 May 26;9:e57410. doi: 10.7554/eLife.57410

Figure 1. Targeted, FRET-based ERK biosensors reveal differential temporal dynamics of subcellular ERK activity.

(A) Domain structure of improved ERK-kinase activity reporter (EKAR4). EKAR4 has two fluorescent proteins (ECFP and YPet) on N- and C-termini, respectively, with an ERK-specific substrate sequence, a phosphopeptide-binding domain (WW), and the EV-linker developed by Komatsu et al., 2011 (B) Pseudocolor images representing the yellow over cyan (Y/C) emission ratio of cytosolic EKAR4 (cytoEKAR4) (top) versus plasma membrane-targeted EKAR4 (bottom) after EGF treatment at time 0. Warmer colors indicate higher Y/C emission ratio, scale bar = 10 µm. (C) Spatiotemporal dynamics of EGF-induced ERK activity in the cytosol. Cytoplasmic ERK activity was monitored using cytoEKAR4 in cells treated with 100 ng/µl EGF (black dotted line, n = 83) or pretreated with 10 µM SCH772984 (ERK inhibitor) 20 min before EGF (blue, triangles, n = 19). Each trace is a combined average of all cells. (D) Spatiotemporal dynamics of EGF-induced ERK activity at the plasma membrane. Plasma membrane localized ERK activity was monitored using the plasma membrane targeted EKAR4 (pmEKAR4) in cells treated with 100 ng/µl EGF (black dotted line, n = 71) or pretreated with 10 µM SCH772984 (ERK inhibitor) 20 min before EGF (blue, triangles, n = 24). Each trace is a combined average of all cells (see Figure 1—figure supplement 1A, B for traces of all cells for C and D; Error bars represent 95% CI.) E) Activity persistence differences of ERK response to EGF between the cytoplasm and plasma membrane. Using the SAM40 metric (Equation 1), the transient versus sustained nature of ERK response to EGF at the cytoplasm (n = 83) and plasma membrane (n = 71) was quantified. (****p<0.0001 using one-way ANOVA multiple comparisons, see Figure 1—figure supplement 1D for comparison to nuclear ERK activity.) See also Figure 1—figure supplement 1, Figure 1—figure supplement 2.

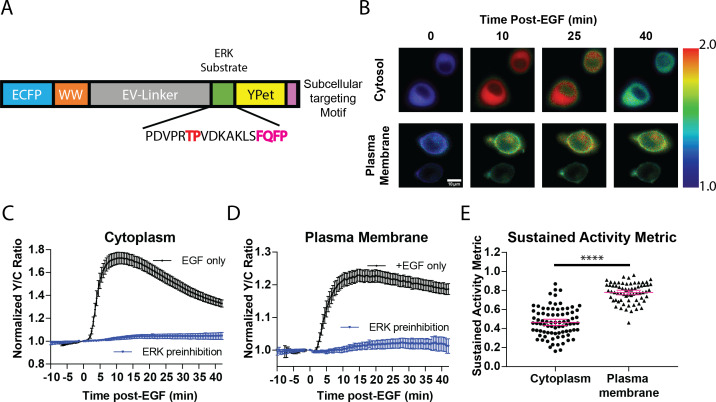
Figure 1—source data 1.

Figure 1.

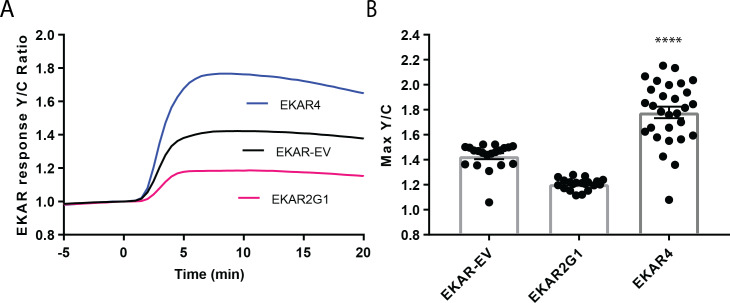
Figure 1—figure supplement 1. Direct comparison of EKAR4 to previous generations of EKAR in HEK-293T cells.

Figure 1—figure supplement 1.

(A) HEK-293T cells expressing either EKAR-EV (color, ref), EKAR2G1 (Color, ref), or EKAR4 (Color) were treated with 100 ng/ml EGF. Traces represent average activation curves from indicated replicates. (B) Amplitude of EGF-induced responses was compared between different EKARs. (p<0.0001).
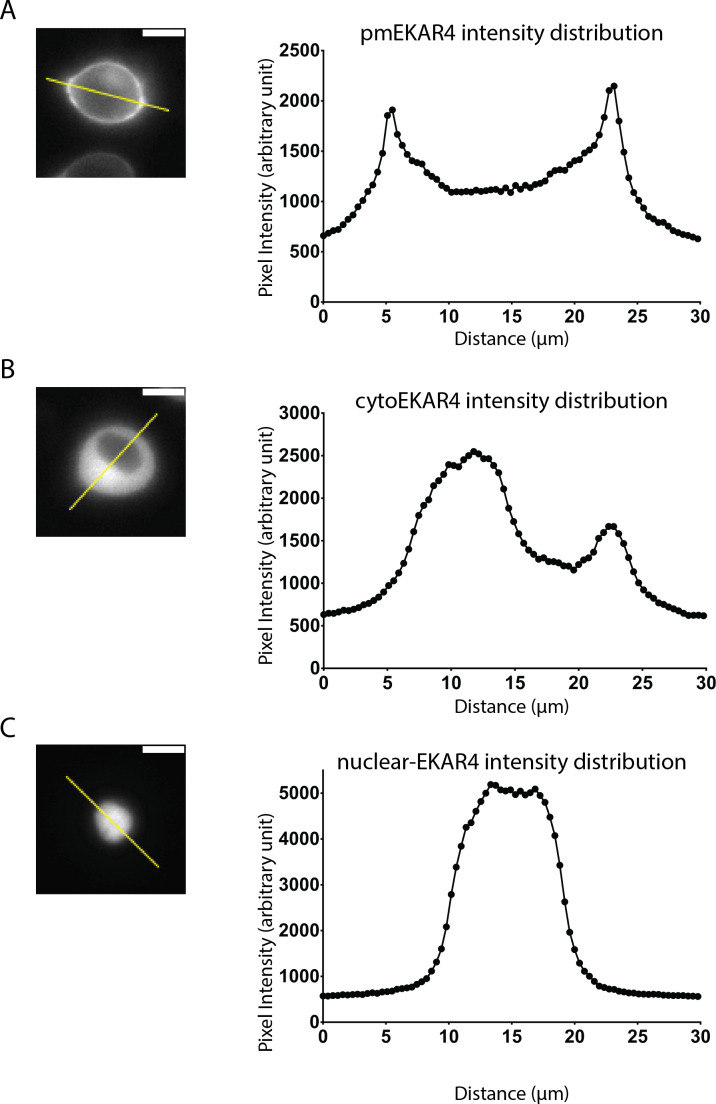
Figure 1—figure supplement 2. Verification of biosensor localization.

Figure 1—figure supplement 2.

Representative cells expressing either pmEKAR4 (A), cytoEKAR4 (B), or nuclear EKAR4 (C) were analyzed by measuring fluorescence intensity of the donor (ECFP) across the indicated line. Scale bar indicates 10 μm.
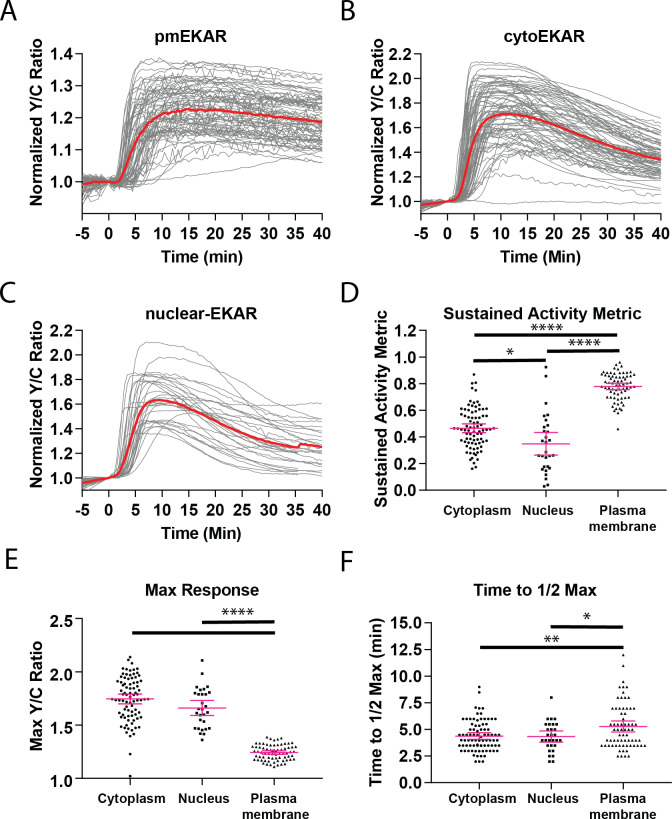
Figure 1—figure supplement 3. Single cell traces of EKAR responses reveal differential dynamics between subcellular locations.

Figure 1—figure supplement 3.

(A) All cell traces (n = 71) from plasma membrane targeted EKAR4 (pmEKAR4) in cells treated with EGF at time 0. Average shown in red. (B) All cell traces (n = 83) of cytosolic EKAR4 (cytoEKAR4) in cell treated with EGF at time 0. (C) All cell traces (n = 29) of nuclear-localized EKAR4 (nuclear EKAR4) in cells treated with EGF at time 0. (D) Sustained activity metric (SAM40) comparing cytoplasmic, nuclear, and plasma membrane EKAR responses. (E) Maximum FRET to donor emission ratio for each EKAR4. (F) EKAR4 response time comparisons between cytoplasmic, nuclear, and plasma membrane compartments. The time to ½ maximum responses was recorded and tabulated. Interestingly, cytoEKAR4 and nuclear EKAR4 respond before pmEKAR4, suggesting faster accumulation of ERK activity in cytosol which is dependent on both ERK and phosphatases. (Metric comparisons analyzed via one-way Anova with multiple comparisons, *p<0.05, **p<0.01, ****p<0.0001).
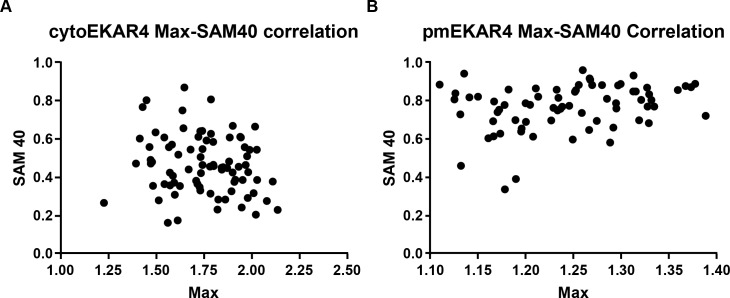
Figure 1—figure supplement 4. No significant correlation between EKAR4 signal amplitude and persistence.

Figure 1—figure supplement 4.

(A) Max Y/C Ratios plotted against SAM40 values for cytoEKAR4 (pearson’s correlation coefficient 0.165). (B) Max Y/C Ratios plotted against SAM40 values for pmEKAR4 (pearson’s correlation coefficient 0.2913).
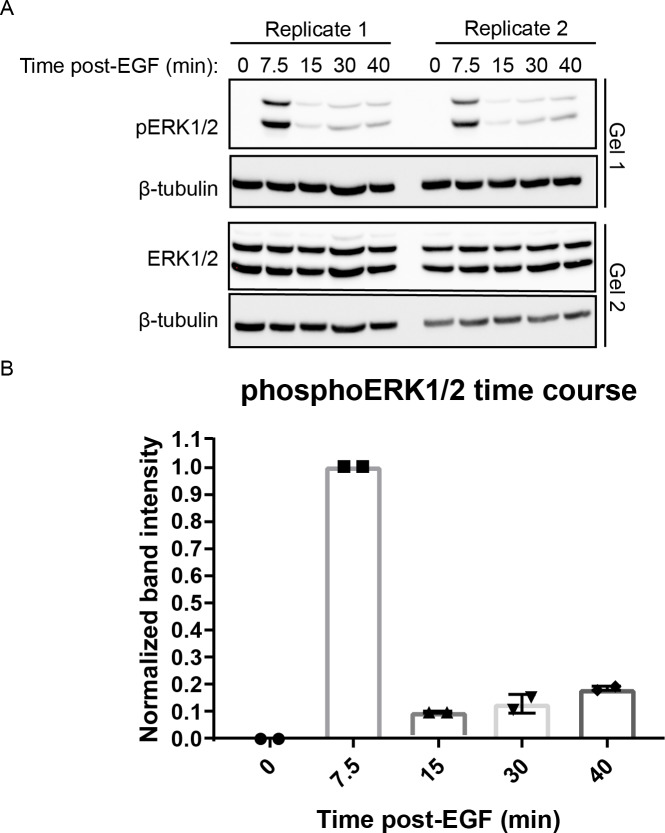
Figure 1—figure supplement 5. phoshpo-ERK time course.

Figure 1—figure supplement 5.

Cells were treated with 100 ng/mL EGF and harvested at indicated time points. Samples from each replicate were loaded on two separate gels and were subjected to western blot against both pERK1/2 (Gel 1) and total ERK1/2 (Gel 2) using β-Tubulin as loading control for each gel. Both ERK1/2 and pERK1/2 bands were normalized to associated β-tubulin loading control. After loading control normalization pERK1/2 was normalized total ERK signals, then the intensity at 7.5 min was set to 1 (n = 2 independent replicates).