. 2020 May 26;9:e57410. doi: 10.7554/eLife.57410

Figure 4. Inhibition of plasma membrane localized ERK activity alters cell morphology, EGF-induced protrusions, and Rac1 activation.

(A) Effect on pmEKAR4 response to EGF in PC12 cells expressing a plasma membrane-targeted monobody EMBer7.1 (pmEMBer) (Mann et al., 2013) which binds to ERK and dampens ERK activity (n = 36 cells, red curve). (B) Effect on cytoEKAR4 response to EGF in PC12 cells expressing pmEMBer (n = 37 cells, red curve) (C) Representative images of cell morphology and protrusion dynamics in response to EGF in PC12 cells with (bottom row) or without (top row) pmEMBer expression. (D) (Left-most panel) Major and minor axes of each cell was measured using ImageJ and the ratio of minor: major was calculated for each cell with and without pmEMBer expression. Kymographs generated from major axes of each cell plotting distance and time (Figure 4—figure supplement 2) were used to quantitate protrusion length in µm and protrusion persistence in min. (Middle and right panels) (n = 103 pmEMBer, n = 57 +pmEMBer, ***p=0.0002, ****p<0.0001) (E) Using Rac1-2G biosensor to measure Rac1 activity (O'Shaughnessy et al., 2019), cells either expressing pmEMBer (red curve, n = 24 cells) or pm-mCherry (black curve, n = 19 cells) were treated with EGF. (F) Quantitation of Max Rac1-2G response to EGF. (p<0.0001, Welch’s t-test to correct for different variances.) See also Figure 4—figure supplement 1, Figure 4—figure supplement 2, Figure 4—figure supplement 3.

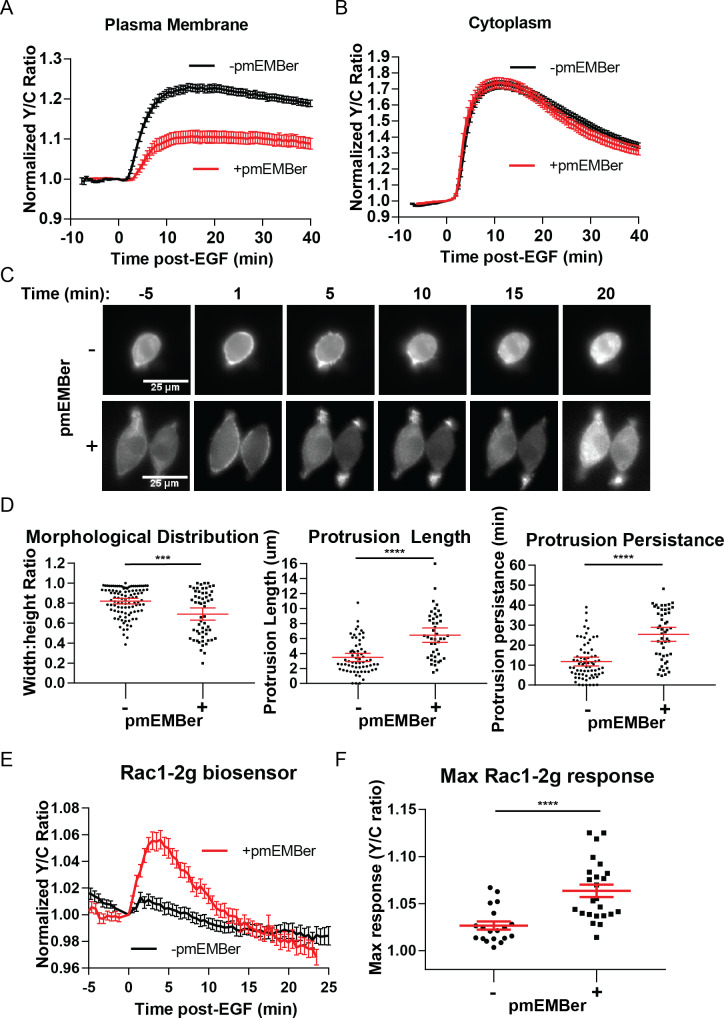
Figure 4—source data 1.
elife-57410-fig4-data1.xlsx (282.2KB, xlsx)

Figure 4.

Figure 4—figure supplement 1. Effects of pmEMBer on ERK and PC-12 responses to EGF.

Figure 4—figure supplement 1.

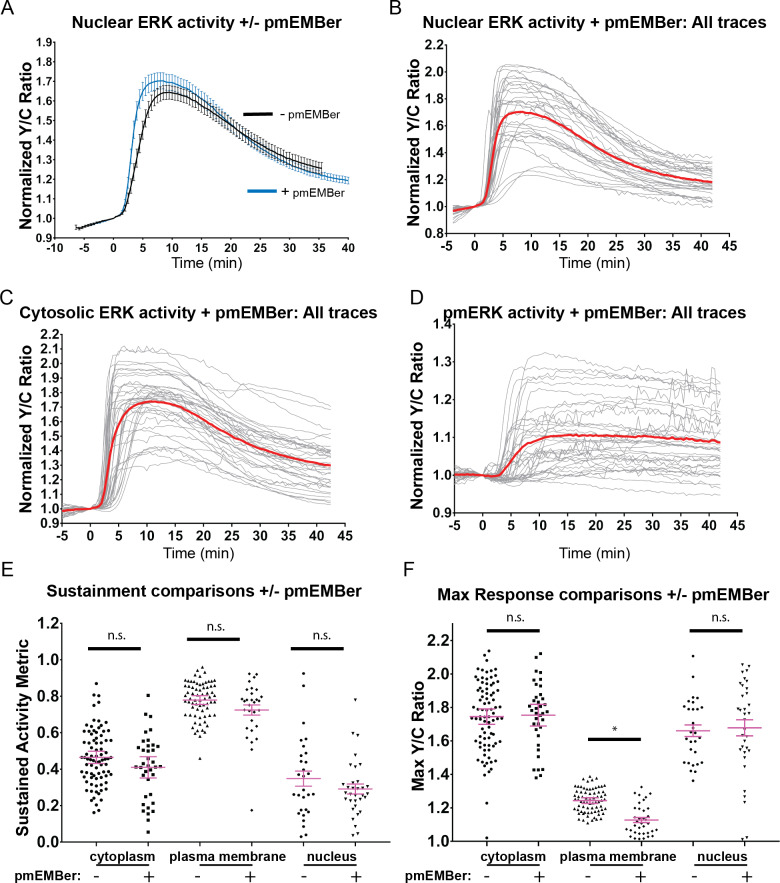
(A) Effect of pmEMBer expression on nuclear ERK response to EGF. (B) All traces of nuclear ERK responses in EGF stimulated cells expressing pmEMBer (n = 32). (C) All traces of cytoplasmic ERK responses in EGF-stimulated cells expressing pmEMBer (n = 75). (D) All traces of plasma membrane ERK responses in EGF-stimulated cells expressing pmEMBer (n = 36). (E) Effect of pmEMBer expression on sustainment of ERK responses, measured by SAM40 metric (Equation 1). Each condition was compared to every other condition using one-way ANOVA with multiple comparisons. Each location (plasma membrane, cytoplasm nucleus) showed no significant change in persistence of ERK activity. (F) Effect of pmEMBer on maximum response (Y/C ratio) at the cytoplasm, plasma membrane, and nucleus. Each condition was compared to every other condition using one-way ANOVA with multiple comparisons. (n.s. = not significant, *p<0.05.).
Figure 4—figure supplement 2. Examples of cell protrusion measurements.

Figure 4—figure supplement 2.

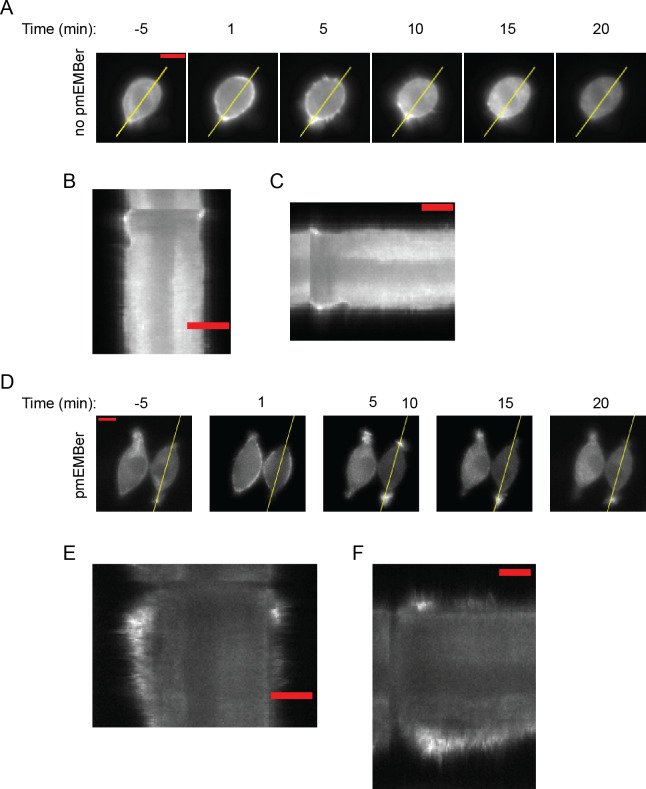
(A, D) Kymograph of indicated area in was obtained along the major axis to quantitate cell protrusions. (B, E) Kymographs of cell shown in (A) and (D), respectively. Scale bar represents 10 µm. (C, F) Kymographs from (B or E) were rotated so that the horizontal axis represents time. Scale bar represents 600 s (10 min.).
Figure 4—figure supplement 3. Effect of pmEMBer on Rac1 and RhoA responses to EGF in PC12 cells.

Figure 4—figure supplement 3.

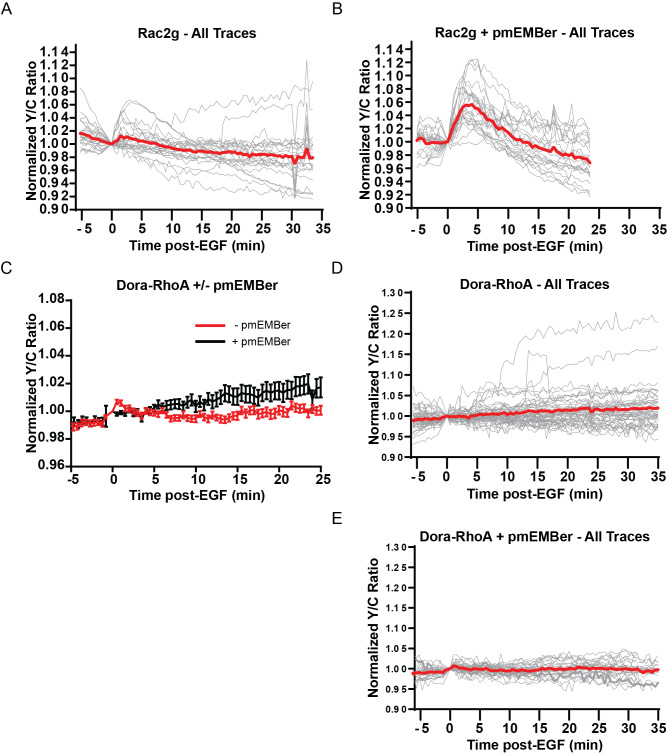
(A) All traces (n = 19) of the effect of EGF on Rac1 measured by the Rac-2G biosensor. Average displayed as red trace. (B) All Traces of Rac1 activity in presence of pmEMBer, n = 24. (C) Average traces comparing RhoA activation in response to EGF with or without pmEMBer expression. (D) All traces of RhoA activation in cells expressing mCh-CAAX control (n = 50). (E) All traces of RhoA activation in cells expressing pmEMBer (n = 30).