. 2020 May 11;9:e53789. doi: 10.7554/eLife.53789

Figure 2. Structure of pUL7 in complex with pUL51.

(A) Hetero-octamer of pUL7 and pUL51(8–142) observed in the crystallographic asymmetric unit. pUL7 and pUL51 are shown as green and cyan ribbons, respectively, in two orthogonal orientations. Inset shows residues arising from the pUL7 cloning tag (pink) that form an eight-stranded β-barrel with residues from pUL51. (B) Core heterodimer of pUL7 (residues 11–296) and pUL51 (residues 41–125). Selected secondary structure elements are labelled. (C) ‘Cut-through’ molecular surface representation of pUL7 (green) showing the intimate interaction interface with the hydrophobic loop and helix α1 of pUL51 (cyan). pUL51 side chains are shown as sticks. (D) Molecular interactions between pUL51 (cyan) and pUL7 (boxed residue names). Hydrophobic and hydrogen bond interactions are in black and red typeface, respectively. (E) Molecular surface representation of pUL7, colored by residue hydrophobicity from white (polar) to orange (hydrophobic). pUL51 is represented as a cyan ribbon with selected side chains shown.

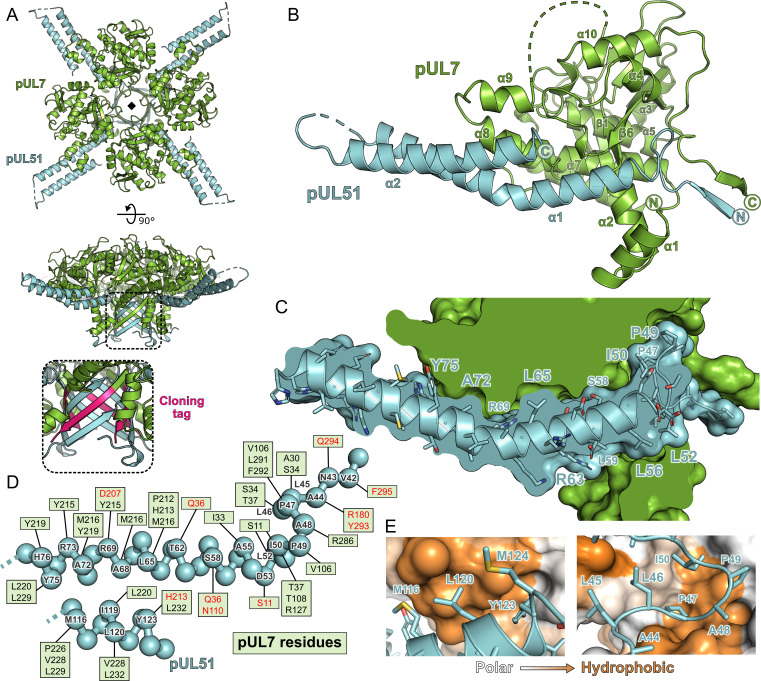
Figure 2.

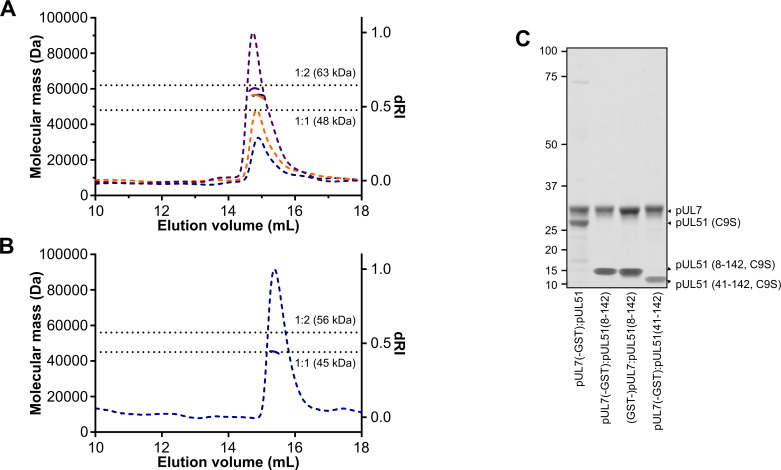
Figure 2—figure supplement 1. SEC-MALS of truncated pUL7:pUL51 complexes.

Figure 2—figure supplement 1.

(A, B) SEC elution profiles (differential refractive index, dashed lines) and weight-averaged molecular masses across the elution peaks (solid lines) are shown. (A) SEC-MALS of pUL7:pUL51(8–142) where pUL7 had been purified using an N-terminal GST tag that was subsequently removed using human rhinovirus 3C protease. Observed mass for the pUL7:pUL51(8–142) complex was 57.4 ± 2.2 kDa, compared with a theoretical mass of 62.7 kDa for a 1:2 heterotrimer. Samples were injected onto the column at 0.3 mg/mL (blue), 0.5 mg/mL (orange) and 1 mg/mL (purple). (B) SEC-MALS of pUL7:pUL51(41–142), injected onto the column at 0.3 mg/mL. The observed mass was 45.1 kDa, compared to a theoretical mass of 44.8 kDa for a 1:1 heterodimer (C) Coomassie-stained SDS-PAGE analysis of samples used for SEC-MALS analysis in (A), (B) and Figure 2. The GST purification tag was cleaved from all samples used for SEC-MALS, the pUL7 protein having been tagged at the N or C terminus during the initial purification steps as shown.
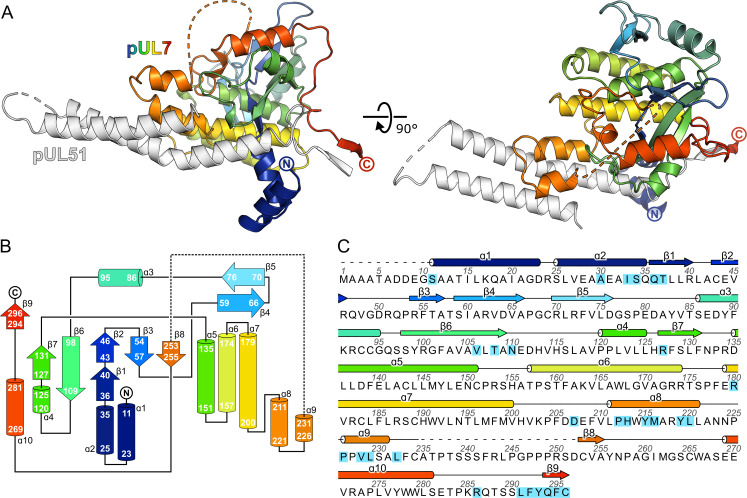
Figure 2—figure supplement 2. The CUSTARD fold of pUL7.

Figure 2—figure supplement 2.

(A) Structure of pUL7:pUL51(8–142) core heterodimer is shown as ribbons, with pUL51 colored white and pUL7 colored from blue (residue 11) to red (residue 296). Two orthogonal views are shown. (B) Schematic diagram of the topology of pUL7. (C) HSV-1 pUL7 sequence, with secondary structure shown above. Residues that interact with pUL51 are highlighted in cyan.
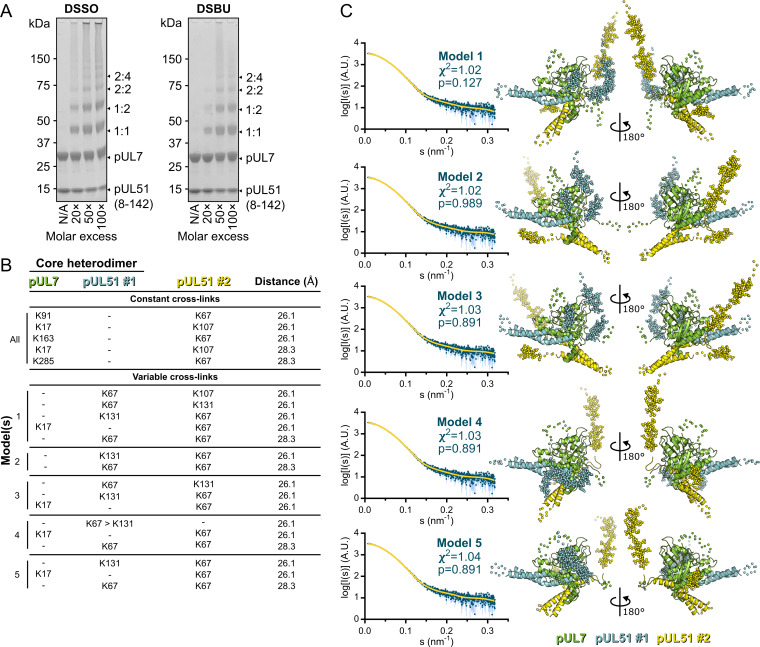
Figure 2—figure supplement 3. Cross-linking mass spectrometry analysis and pseudo-atomic modelling of the pUL7:pUL51(8–142) solution heterotrimer.

Figure 2—figure supplement 3.

(A) Coomassie-stained SDS-PAGE analysis of purified pUL7:pUL51(8–142) following 30 min incubation at room temperature with varying molar excesses of the cross-linking agents DSSO (left) or DSBU (right). Theoretical migration of proteins corresponding to pUL7, pUL51(8–142), and 1:1, 1:2, 2:2 or 2:4 complexes thereof, are indicated. (B) Cross-linking restraints used for pseudo-atomic modelling of the pUL7:pUL51(8–142) heterotrimer. Restraints used for all models (‘constant cross-links’) and permuted restraints (‘variable cross-links’) that were used for the five best-fit (lowest χ2) models are shown. (C) The five best pseudo-atomic models (lowest χ2) generated by fitting to the pUL7:pUL51(8–142) SAXS profile as described in Materials and Methods using the restraints shown in (B). The core heterodimer of pUL7 (residues 11–234 and 253–296; green) and pUL51 (residues 41–89 and 96–125; #1, cyan) and the additional molecule of pUL51 (residues 41–89 and 96–125; #2, yellow) are shown as ribbons (right). Additional regions modelled using I-TASSER or CORAL are shown as spheres. The fit of the computed scattering (yellow) to the pUL7:pUL51(8–142) SAXS profile (aqua) is shown for each model (left), as are reduced χ2 and CorMap P-values (Franke et al., 2015; Petoukhov et al., 2012).