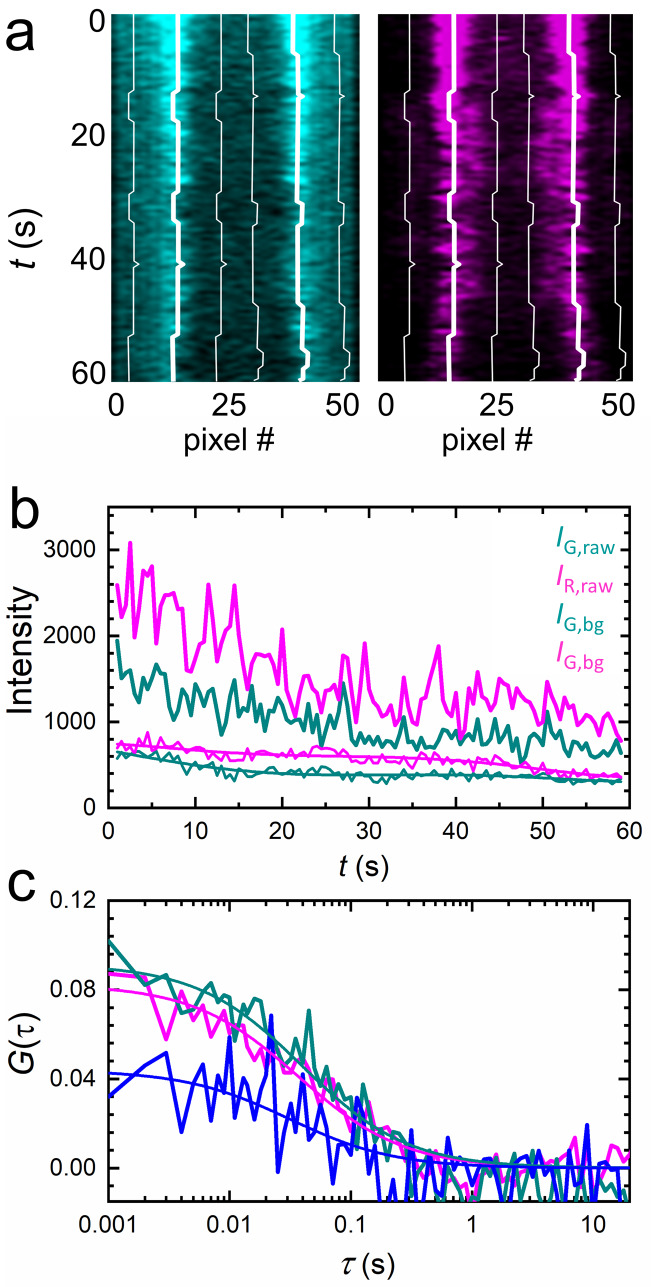
Figure 4. Extraction of correlation functions from axial lsFCS intensity time traces on live NCI-H1703 cells stably transfected with LRP6-mCherry and immersed in CM containing 5 nM DKK1-eGFP.
(a) Kymograph of the membrane scan recorded in the green (ligand, left) and red (receptor, right) color channels, showing the fluorescence from the membrane during 60 s of axial scanning (500 ms binning time). Thick white lines trace the membrane positions. (b) Time traces of the raw ligand (IG,raw) and receptor (IR,raw) intensities from the membrane and the corresponding background, IG,bg and IR,bg, determined ±10 pixels away from the membrane (thin white lines in panel a). Lines through, IG,bg and IR,bg are sums of six sine functions fitted to the data for noise filtering. (c) Autocorrelation (cyan, DKK1-eGFP; magenta, LRP6-mCherry) and cross-correlation (blue) functions after background and photobleaching corrections.


