
Figure 6. Axial lsFCS on transiently and stably transfected as well as CRISPR/Cas9 gene edited NCI-H1703 cells and transiently transfected HEK293T cells, all expressing LRP6-mCherry on their plasma membranes.
(a) Densities of fluorescently labeled receptors, determined from the autocorrelation amplitudes, GR(0), using ω0 = 0.25 µm. Each data point corresponds to an individual 60-s experiment. Boxes mark the 25 – 75% range; the median is shown as the central line and the mean as a black square. Whiskers indicate the SD. (b) Fractional occupancies, , of receptors with Dkk1-eGFP as a function of the ligand concentration in the CM. Symbols (shapes/colors as in panel a), experimental data (mean ± SEM from at least three axial scans of 60 s each); lines, fits with Equation 5.
Figure 6—source data 1. Numerical data of the plots in Figure 6.
elife-55286-fig6-data1.xlsx (28.5KB, xlsx)

Figure 6—figure supplement 1. Axial lsFCS on HEK293T and NCI-H1703 cells transfected with LRP6-mCherry, measured at 37°C and 5% CO2.
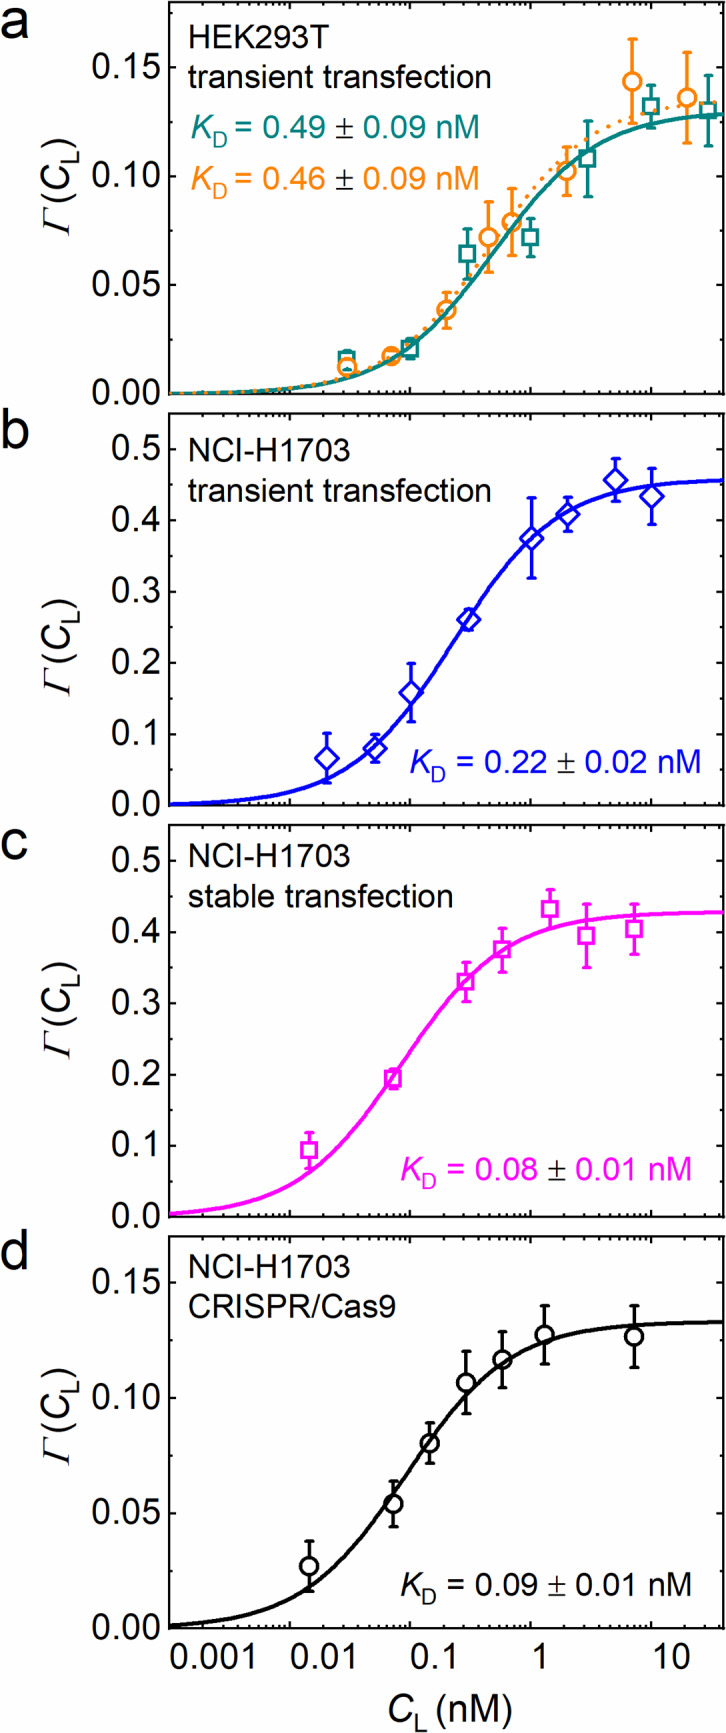
Г(CL) is plotted as a function of the DKK1-eGFP concentration CL. (a) Transiently transfected HEK293T cells. Data taken with DKK1-eGFP-SNAP as a ligand are included in cyan. (b) Transiently transfected NCI-H1703 cells. (c) Stably transfected NCI-H1703 cells. (d) NCI-H1703 cells expressing endogenously tagged LRP6-mCherry after CRISPR/Cas9 genome editing. Symbols, data; lines, fits with Equation 5.
Figure 6—figure supplement 2. Comparison of DKK1-eGFP and DKK2-eGFP binding to NCI-H1703 cells stably transfected with LRP6-mCherry.

(a) Г(CL) as a function of DKK1-eGFP (magenta) and DKK2-eGFP (orange) ligand concentrations CL. Symbols represent data (mean ± SEM) from five axial scans of 60 s each; lines are fits with Equation 5, yielding the parameters KD = 0.08 ± 0.01 nM and β = 0.44 ± 0.02 for DKK1-eGFP and KD = 0.26 ± 0.04 nM and β = 0.43 ± 0.02 for DKK2-eGFP. (b) Corresponding binding isotherm F(CL) as a function of DKK1-eGFP and DKK2-eGFP ligand concentrations.
Figure 6—figure supplement 3. Axial lsFCS on transiently transfected and CRISPR/Cas9 endogenously tagged NCI-H1703 cells expressing LRP6-tdTomato.

(a) Receptor densities, each data point represents an individual cell, boxes mark the 25–75% range. The median is indicated by the central line, the mean as a small black square. Whiskers mark the SD. (b) Г(CL) and (c) corresponding binding isotherms F(CL) as functions of DKK1-eGFP ligand concentration CL. Symbols represent data obtained from five axial scans of 60 s each (mean ± SD); lines are fits with Equation 5.