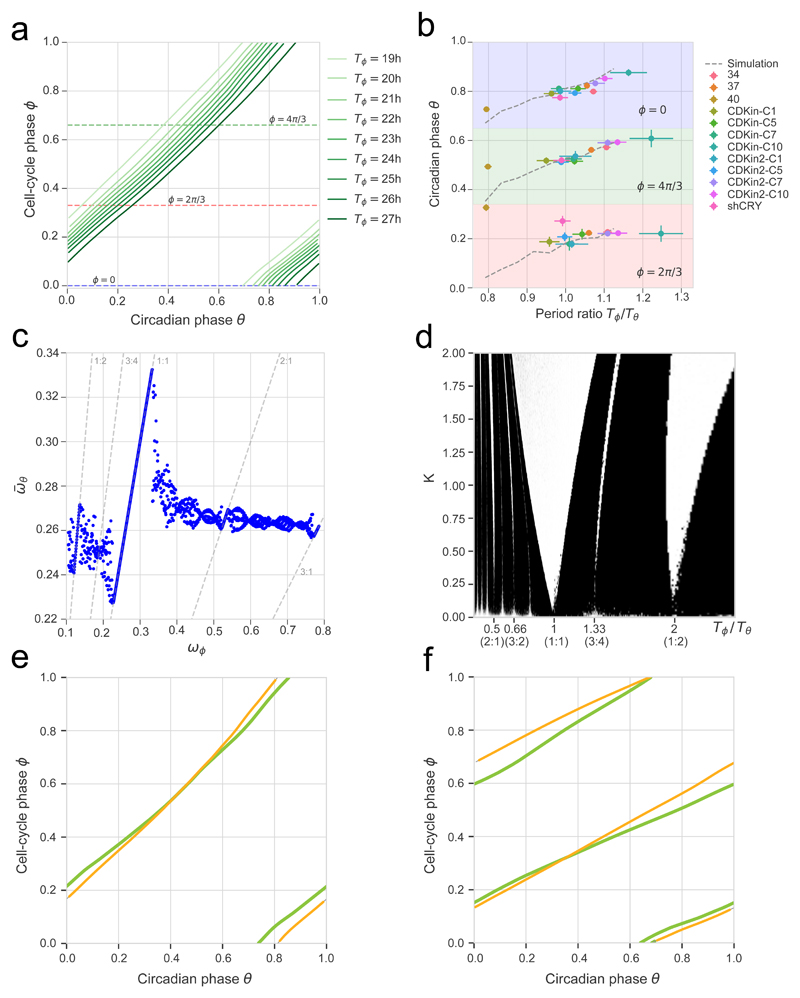
Figure 3. The coupling between the cell cycle and the circadian oscillator predicts phase shifts and phase-locking attractors in perturbation experiments.
(a) Simulated (deterministic) attractors for cell-cycle periods ranging from 19h to 27h show that the dephasing of the cell cycle and the circadian oscillator changes within the 1:1 state. Periods just outside of this range yield quasiperiodic orbits. The horizontal dashed lines indicate three different cell-cycle phases used in panel (b). (b) Predictions from a) (dashed grey lines) against independent experimental data collected from 12 perturbation experiments (colored symbols, see legend, notation explained in Methods). (c) Multiple phased-locked states are predicted, recognizable by rational relationships between the frequencies of the entraining cell cycle and the entrained circadian oscillator, interspersed by quasiperiodic intervals. (d) Arnold tongues showing multiple phase-locked states in function of cell-cycle periods and coupling strength (K=1 corresponds to the experimentally found coupling). Stable zones (white tongues) reveal attractors interspersed by quasi-periodicity. Although there are only two wider phased-locked state (1:1 and 1:2), several other p:q states are found. (e-f) Representative single-cell traces (data in yellow) evolving near predicted attractors (green lines). A cell with Tϕ = 24h (e) and one with Tϕ = 48h (f) near the 1:1 and 1:2 orbits, respectively.

