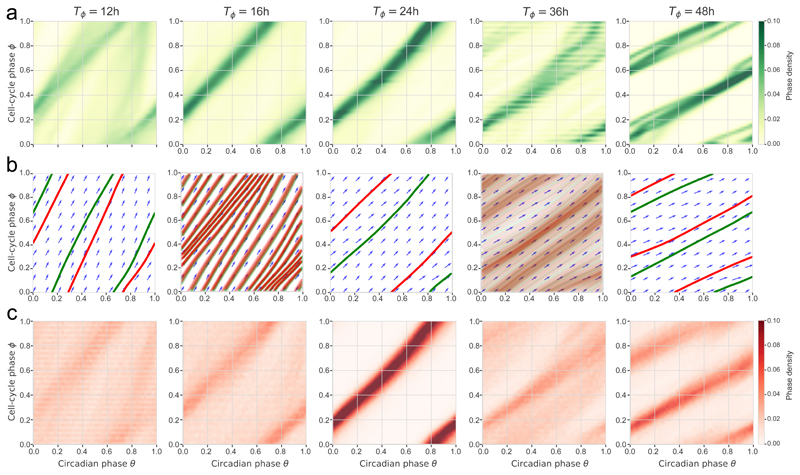
Figure 4. Single-cell data and stochastic simulations reveal robust 1:1 and 1:2 phase-locked states.
(a) Phase-space densities from the experimental traces stratified by cell-cycle periods (±1h for each reference period); n=16, 223, 303, 54, 4 cell traces in the T=12, 16, 24, 36, 48 h panels, resp. (b) Vector fields and simulated (deterministic) trajectories for the different cell-cycle periods. Attractors are shown in green (forward time integration) and repellers (backward integration) in red (see also Movie 2). (c) Phase-space densities obtained from stochastic simulations of the model match better with the data compared to b).

