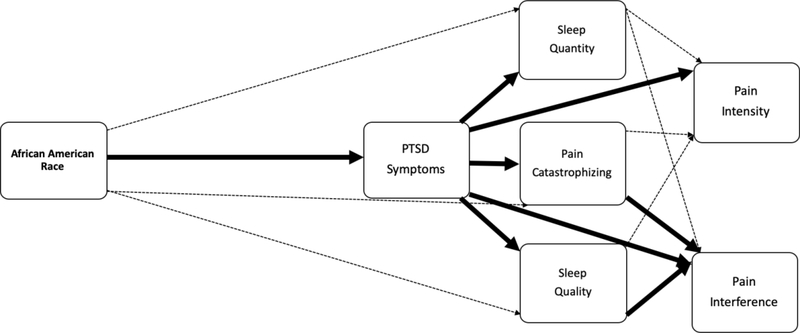
Figure 3.
Visual depiction of results from evaluation of Conceptual Model #1. Solid dark lines represent significant direct effects (p < .05) and dashed light lines represent non-significant direct paths (p >.05). Please refer to Table 3 for corresponding standardized path coefficients of direct and indirect effects.

