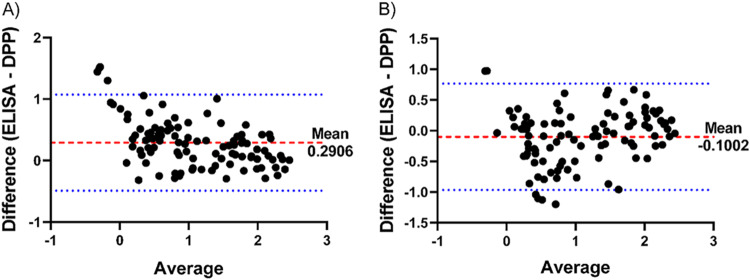
FIG 5.
Bland-Altman plot of ELISA and DPP Typhoid System measurements. (A and B) Plot of log-transformed anti-LPS (A) and anti-HlyE (B) IgA plasma measurements by ELISA and DPP Typhoid System of acute enteric fever (S. Typhi and S. Paratyphi A) cases and controls (endemic healthy and febrile controls). The red dashed line indicates the mean difference between measurements. The blue dotted lines represent the 95% limits of agreement.

