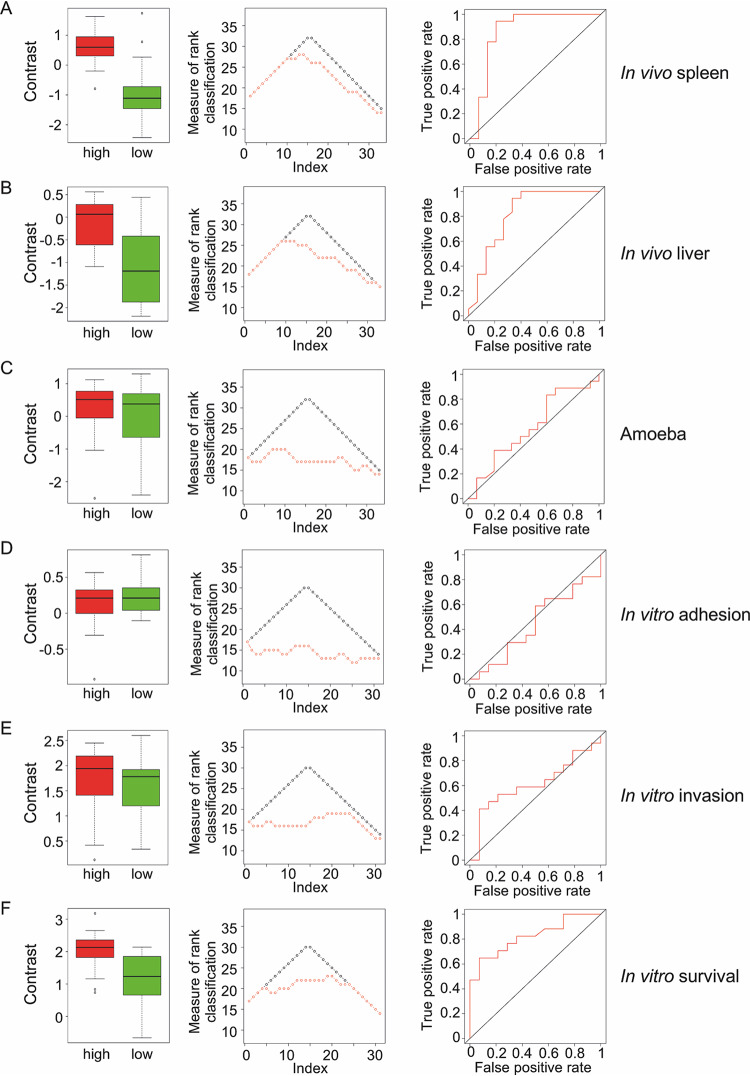
FIG 6.
Concordance analysis to test virulence prediction. (A to E) Distributions of contrasts in low- and high-prediction groups (left), measure of rank classification (middle) and ROC curves (right) for the different models. The distribution of contrast values in each group (predictions, low and high) was evaluated using t test and Mann-Whitney Wilcoxon test. The variance explained (R2) was calculated using ANOVA with one factor (prediction group: low or high). Percentage of agreement compared the groups (low versus high) from the prediction and the groups (low versus high) from the observations based on contrast. For the measure of rank classification, perfect prediction is shown in black and observed prediction in red.

