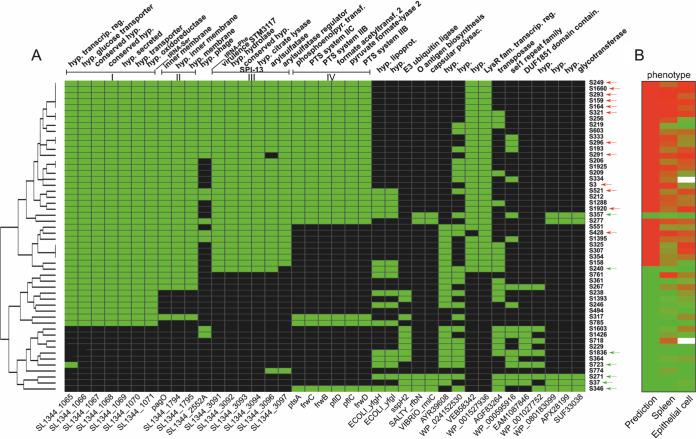
FIG 7.
Distribution of virulence genes in Salmonella isolates used in the PCA-based prediction model. (A) Heat map showing the distribution of 39 genes correlating with the levels of virulence. Column labels indicate gene names (bottom) and functions (top). The gene names at the bottom refer either to the genes in Salmonella Typhimurium SL1344 or, when no annotation was available, to a generic name generated by Prokka (linked to Table S1 in the supplemental material). The lines above mark contiguous genes on the S. Typhimurium SL1344 chromosome and show four clusters (I to IV). Green cells indicate that the gene is present, whereas black cells indicate its absence from a given isolate. The tree on the left shows isolates ordered based on hierarchical clustering. The identifiers (IDs) of the isolates are shown on the right. Red arrows indicate high-virulence isolates, and green arrows indicate low-virulence isolates that were used for PCA analysis. hyp, hypothetical; transcrip, transcriptional; reg, regulator; phosphoenolpyr transf, phosphoenolpyruvate transferase; acetyltransf, acetyltransferase; lipoprot, lipoprotein; polysac, polysaccharide; fam, family. (B) Heat map showing the distribution of predicted phenotype and phenotype in vivo (spleen) and in vitro (epithelial cell survival). Isolates were ranked according to the distribution of contrasts. Red cells, high virulence; green cells, low virulence. Isolates S324 and S718 (empty cells) were gentamicin-resistant and not tested in vitro.

