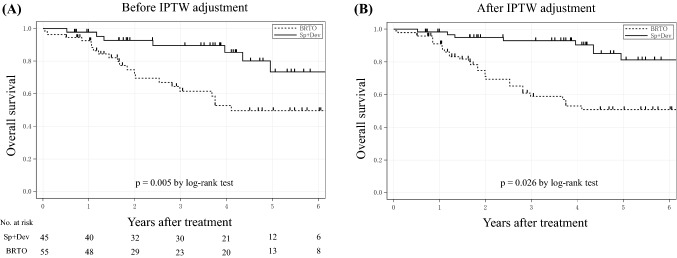
Fig. 2.
a Overall survival (OS) in the Sp + Dev and BRTO group in all patients. Note the significantly lower OS following Sp + Dev compared to BRTO (p = 0.005). b OS in the Sp + Dev and BRTO groups after IPTW adjustment. Note a significantly lower OS after Sp + Dev compared to the BRTO groups (p = 0.048). Sp + Dev splenectomy and gastric devascularization, BRTO balloon-occluded retrograde transvenous obliteration, IPTW inverse probability of a treatment weighting

