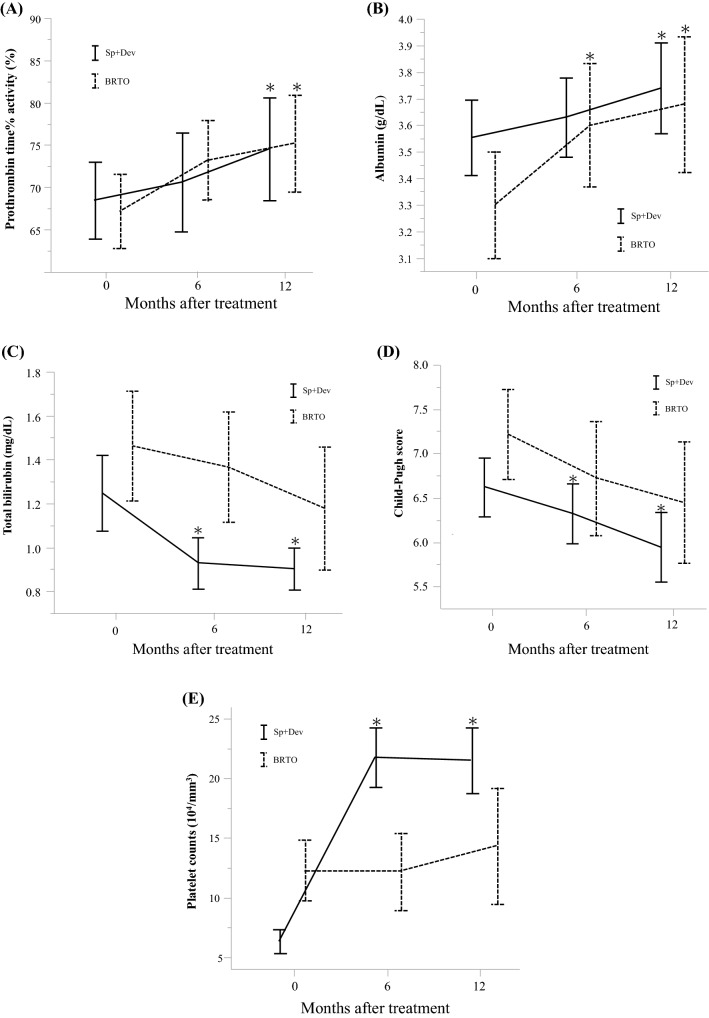
Fig. 4.
Dynamics of liver function after Sp + Dev (n = 45) and BRTO (n = 55) assessed by paired t test: changes in a PT%, b albumin, c total bilirubin, d Child–Pugh score, and e platelet counts differed by procedure over time. Variables expressed as the mean ± 95% confidence interval. Sp + Dev splenectomy and gastric devascularization, BRTO balloon-occluded transvenous obliteration, PT% prothrombin time% activity. *p < 0.050

