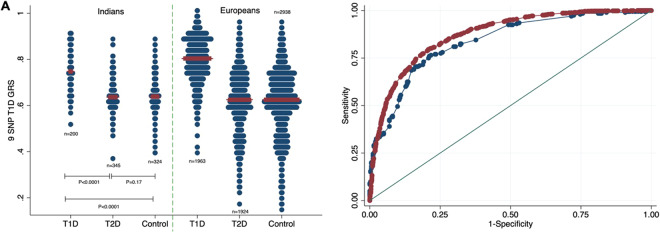
Figure 1.
Comparison of the ability of a 9 SNP GRS to discriminate between T1D and T2D in Indians and Europeans. (A) Dotplot of 9 SNP T1D GRS in T1D, T2D and controls in Indians and Europeans. The width of the blue bars indicates frequency and the red line indicates the median. (B) ROC curves showing the power of the 9 SNP T1D GRS to discriminate between T1D and T2D in Indians (blue: AUC [95% CI] 0.84 [0.80–0.87]) and Europeans (red: AUC [95% CI] 0.87 [0.86–0.88]), P < 0.001.

