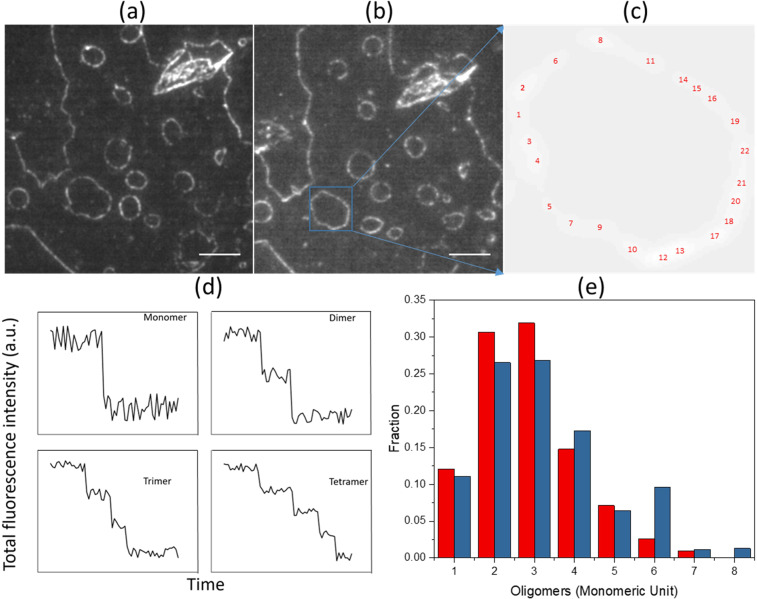
Figure 5.
Determination of the size of Aβ oligomers within the pearl necklace-like assemblies. (a) Image taken before single molecule photobleaching experiment after 2 hr incubation; (b) image taken after complete photobleaching and then another incubation for 12 hr. Scale bars are 10 µm for both a,b; (c) A localization map for all monomers and oligomer detected in the highlighted assembly; (d) Exemplar photobleaching profiles for monomer, dimer, trimer, and tetramer; (e) Size distribution of Aβ oligomers with PIF software version 1.1.2 (http://www.biophys.umontreal.ca/bluncklab/software.html) analysis of images taken from 2 hr incubation (Red) and after complete photobleaching and 12 hr incubation for the same areas (Blue).

