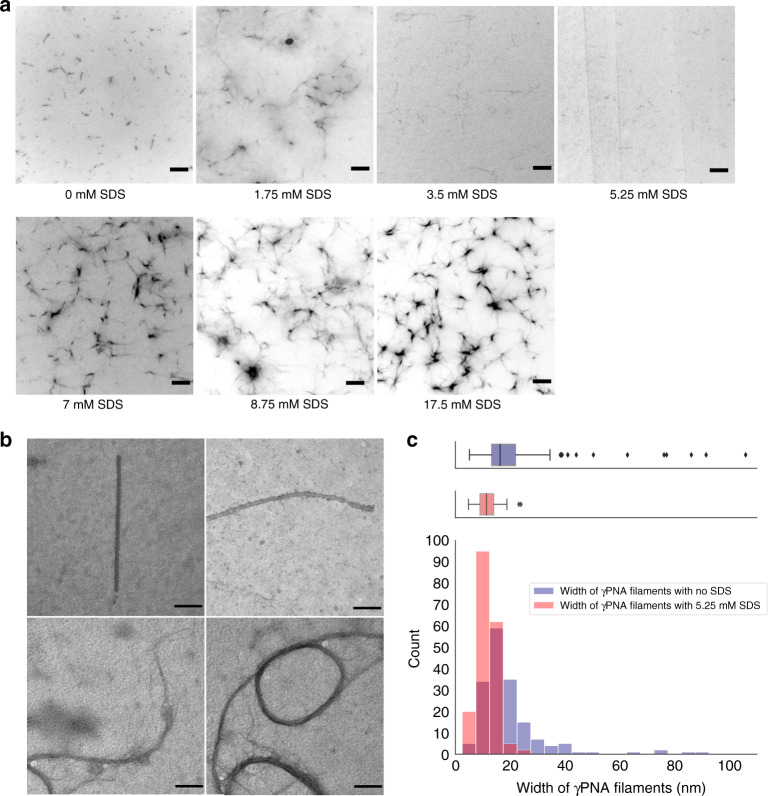
Fig. 4. Effect of SDS on the width of γPNA nanofibers during self-assembly using TIRF and TEM assays.
a TIRF panels (5 μm scale bar) of the self-assemblies formed by γPNA in 75% DMSO:H2O (V V−1) with different concentration of SDS ranging from 0 to 17.5 mM (repeated over 2 independent experiments for each condition). With increasing concentrations of SDS [0–5.25 mM], thinner morphologies of the nanofibers become more dominant. When concentrations of SDS neared or exceeded the CMC concentration (8.2 mM), networked morphologies of γPNA with increasing propensity was observed. b TEM panels (100 nm scale bar) of γPNA nanostructures annealed in 75% DMSO:H2O (V V−1) with 5.25 mM SDS shows nanofibers with diameters of 8–12 nm range. c Overlay of width distribution of γPNA nanostructures with 5.25 mM SDS (sample size, N = 185 visibly separate nanostructures over 2 independent experiments, red) and without SDS (sample size, N = 171 visibly separate nanostructures over 4 independent experiments, blue) using TEM studies. Nanofibers in the presence of 5.25 mM SDS show a tight distribution with a median width of 11.3 nm and IQR of 5 nm. Source data are provided as a Source data file.

