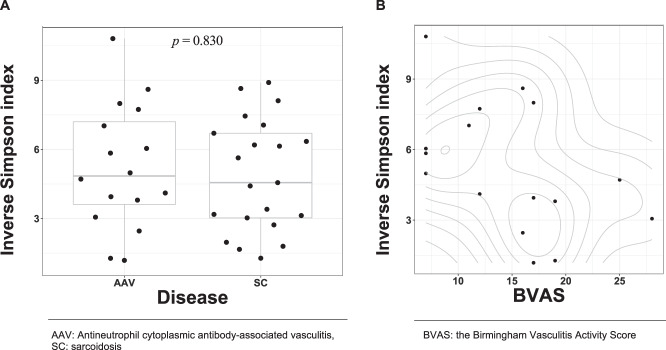
Figure 2.
The association of the α-diversity with the diseases and BVAS. (A) The difference in the inverse Simpson index between diseases. The width of the dots’ distribution on each box plot was based on corresponding kernel-density estimation with Gaussian-kernel. Each box denotes corresponding interquartile range and each horizontal line in the middle of each box denotes the median of corresponding density estimates. (B) The bivariate relationship between the inverse Simpson index and BVAS. The contour lines show the two-dimensional probability density obtained from a kernel density estimate.

