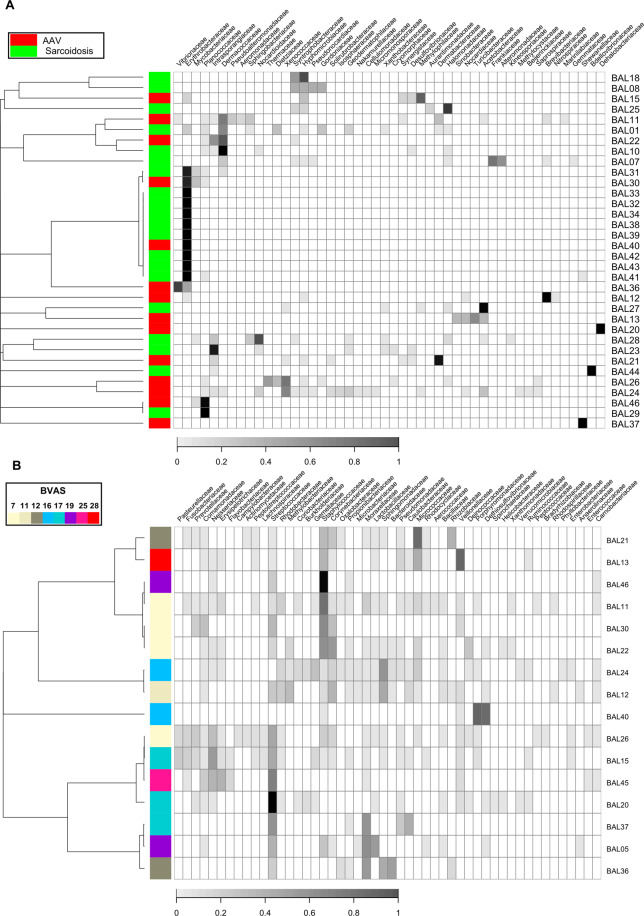
Figure 7.
The microbiota composition and dendrogram of the subjects obtained from an analysis from which the set of taxa of “vagrant” was excluded. The grayscales in heatmaps represent the relative abundance of each taxon. (A) The red and green tiles on the first column in the heatmaps denote respective disease groups (AAV and sarcoidosis) to which corresponding subjects belonged. (B) The colour of each tile on the first column in the heatmap indicate BVAS in corresponding subject. For both of (A) and (B), the dendrograms in the left side of the heatmaps show results from hierarchical clustering with the complete linkage method on the Morisita-Horn dissimilarity index. The taxa were sorted by hierarchical clustering with single linkage method on the Jaccard distance between rows.

