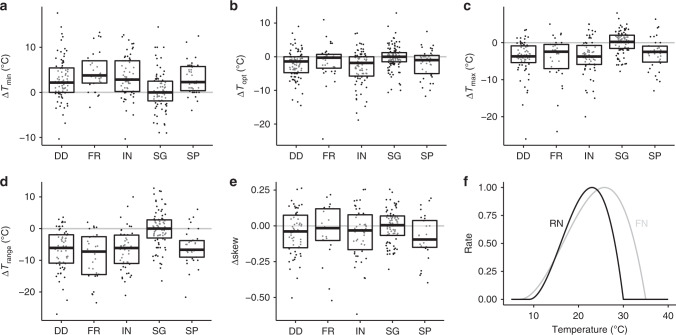
Fig. 2. Temperature response differences to growth in culture.
a Tmin, b Topt, c Tmax, d Trange and e Skew. Processes are disease development (DD), fruitification (FR), infection (IN), spore germination (SG) and sporulation (SP). a–e Boxplot boundaries reflect the inter-quartile range, the horizontal bar is the median. Summary statistics including sample sizes are reported in Supplementary Table 2. f Illustration of temperature response (beta function) for the fundamental niche (grey, represented by growth in culture) compared with the realized niche (black, represented by disease development), where RN has a narrower Trange and lower Topt than FN.

