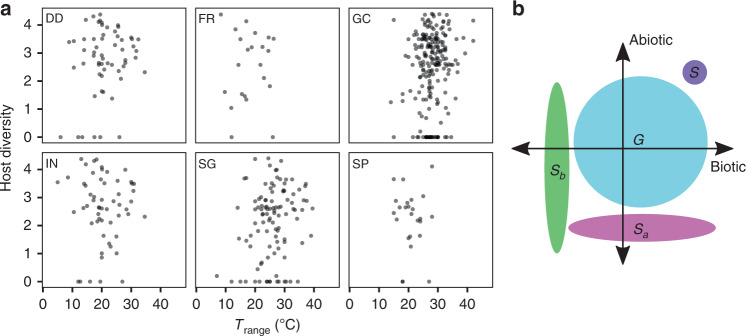
Fig. 3. Biotic vs. abiotic niche breadth.
a Biotic niche breadth is represented by log-transformed host phylogenetic diversity calculated from the processed host phylogeny, and abiotic niche breadth by Trange. Panels show the different biological processes, disease development (DD, N = 59), fruitification (FR, N = 22), growth in culture (GC, N = 209), infection (IN, N = 57), spore germination (SG, N = 105) and sporulation (SP, N = 25). b Schematic of niche breadth on biotic and abiotic axes for a true specialist (S, purple), true generalist (G, blue), biotic specialist with wide climatic tolerances (Sb, green) and abiotic specialist with broad host range (Sa, magenta).

