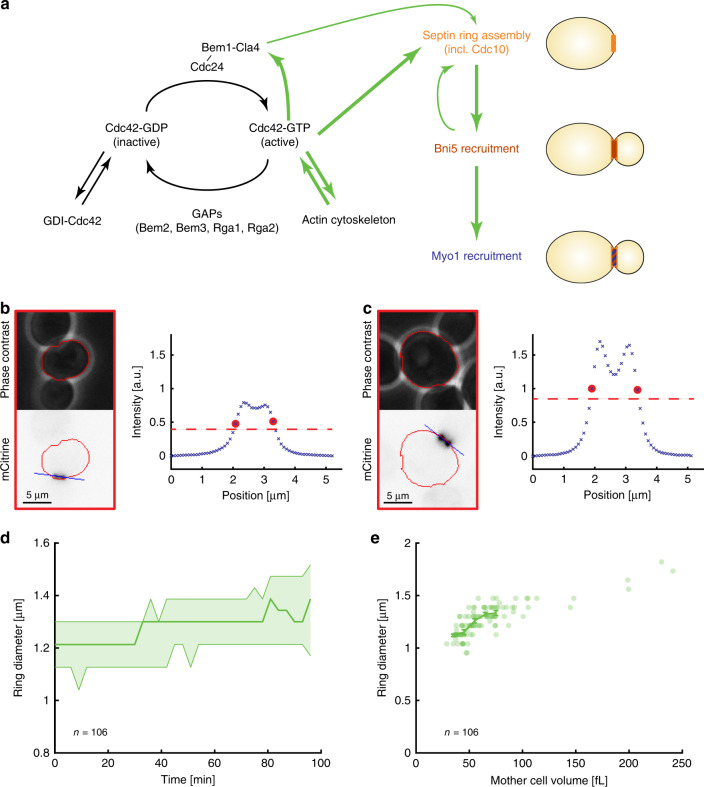
Fig. 1. Septin ring diameter increases with cell volume.
a Illustration of the regulatory pathways controlling cell polarization and downstream ring assembly at the bud neck. Representative live-cell microscopy images (phase contrast (top) and Cdc10-mCitrine fluorescence (bottom)) of a small (b) and big (c) cell 15 min before the disappearance of the septin ring. Red outline shows automated cell segmentation based on phase contrast used to estimate cell volume. Blue shows the automatically determined line parallel to the ring used to estimate ring diameter. The corresponding fluorescence intensity profiles after applying gliding average and background subtraction are shown for both cells. Red circles show positions used to estimate septin ring diameter, dashed red lines denote half maximum. d The median ring diameter (thick line) as quantified from Cdc10-mCitrine fluorescence signal is shown as a function of the time since the first frame where the ring was detected for analysis. Error bars show 25 and 75 percentiles. Data for a total of 106 cells pooled from three independent experiments are shown for the time range during which a ring was detected for at least 15 cells. e For each cell (n = 106), the median ring diameter during the time when the ring is detected is shown as a function of the median cell volume during that time. Raw data are shown in Supplementary Fig. 1f. Error bars denote means and standard errors. Cells were grown on SCGE. Source data are provided as a Source Data file.

