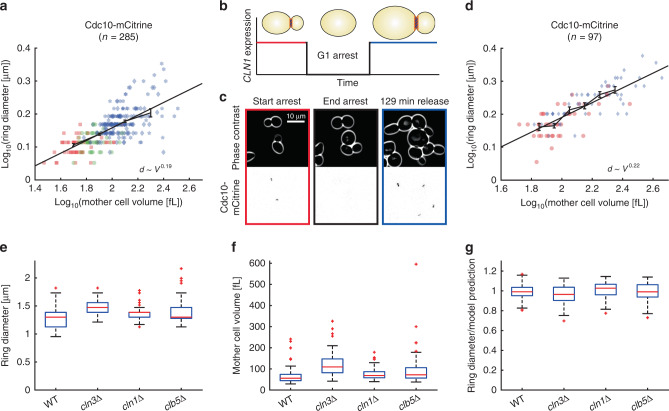
Fig. 3. Ring diameter increases with cell volume for cells grown in SCD and is not sensitive to CDK activity.
a Septin ring diameter based on Cdc10-mCitrine fluorescence as a function of cell volume. Cell volume was controlled through β-estradiol-dependent expression of Whi5 (red squares: 0 nM; green circles: wild type; blue: 60 nM (diamonds), 90 nM (pentagrams), 120 nM (hexagrams)). For each cell, the median ring diameter during the time when the ring is detected is shown as a function of the median cell volume during that time. Data from different conditions are pooled (285 cells from five independent experiments) and a linear fit to the double-logarithmic data as well as binned means with standard error is shown. b A cln1/2/3Δ strain carrying a β-estradiol-inducible CLN1 allele and CDC10-mCitrine was used to measure septin ring diameter as a function of cell volume. Ring diameter was measured for cells growing in the presence of β-estradiol, or cells released from G1 arrest after 2.5 h of β-estradiol withdrawal. c Representative live-cell microscopy images (phase contrast (top) and mCitrine fluorescence (bottom)). d For each cell, the median ring diameter is shown as a function of the median cell volume. Pre-arrest (red circles) and post-G1-arrest data (blue diamonds) were pooled (97 cells from three independent experiments), and a linear fit to the double-logarithmic data as well as binned means with standard errors is shown. Cells were grown on SCD. e–g Cell volume and septin ring diameter based on Cdc10-mCitrine fluorescence were measured in haploid cyclin deletion mutants cln3Δ (64 cells pooled from two independent experiments), cln1Δ (97 cells pooled from two independent experiments), and clb5Δ (52 cells pooled from two independent experiments) and compared with wild-type haploids (106 cells pooled from three independent experiments). Boxplots show distributions of median septin ring diameters (e) and median cell volume (f). g For each cell, we compare the measured ring diameter to the value expected for wild-type cells with the same mother cell volume based on the power law fit obtained for wild-type and inducible-Whi5 cells shown in Fig. 2c. Boxplots depict the distribution of the ratios of measured and expected ring diameters. Cells were grown on SCGE. Boxplots depict medians, 25 and 75 percentiles. Whiskers denote extreme values still within 1.5 interquartile ranges, red symbols denote outliers. Source data are provided as a Source Data file.

