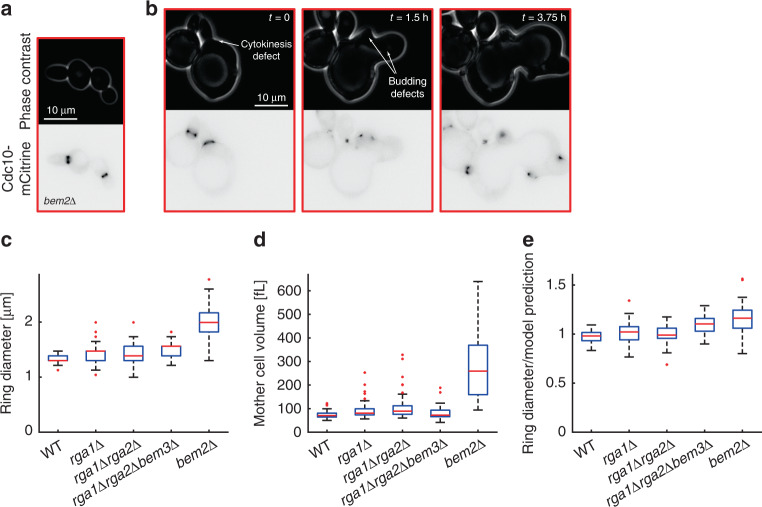
Fig. 6. Increased ring diameter in bem2Δ cells is largely explained by increased cell volume.
Cell volume and septin ring diameter based on Cdc10-mCitrine fluorescence were measured in haploid GAP deletion mutants rga1Δ (43 cells pooled from two independent experiments), rga1Δrga2Δ (50 cells pooled from two independent experiments), rga1Δrga2Δbem3Δ (42 cells pooled from two independent experiments), and bem2Δ (42 cells pooled from two independent experiments) and compared with wild-type haploids (52 cells pooled from two independent experiments). Cells with obvious defects in bud formation, cytokinesis, and septin morphology were rejected from the analysis. Live-cell microscopy images of bem2Δ cells (phase contrast (top) and mCitrine fluorescence (bottom)) show typical examples of normal ring morphology included in the analysis (a), and a timecourse of a typical cell rejected from the analysis due to cytokinesis and budding defects (b). c Boxplots showing the distribution of septin ring diameters. For each cell, the median ring diameter during the time when the ring is detected is measured. d Boxplots of the median cell volume during that time. e For each cell, we compare the measured ring diameter to the value expected for wild-type cells with the same mother cell volume based on the power law fit obtained for wild-type and inducible-Whi5 cells grown on SCD shown in Fig. 3a. Boxplots depict the distribution of the ratios of measured and expected ring diameters. Cells were grown on SCD. Boxplots depict medians, and 25 and 75 percentiles. Whiskers denote extreme values still within 1.5 interquartile ranges, red symbols denote outliers. Source data are provided as a Source Data file.

