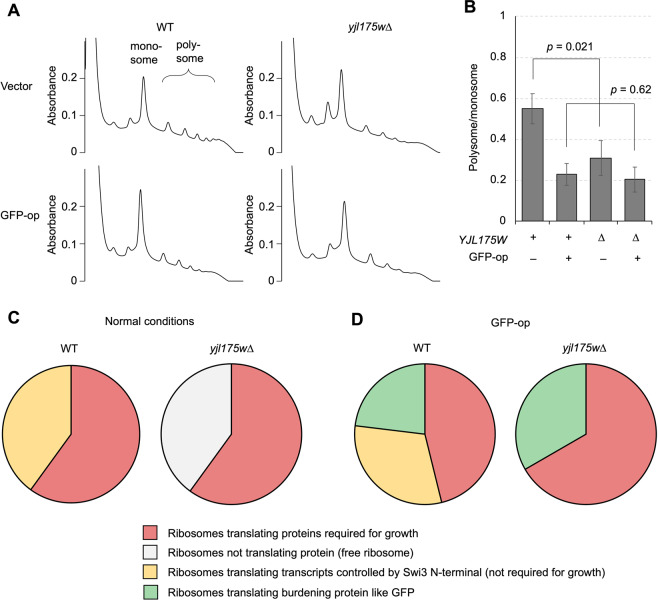
Figure 4.
Translational consequence upon deletion of YJL175W. (A) Polysome profiling of WT and yjl175w∆ cells under normal (vector) and GFP-op conditions. Predicted monosome and polysome peaks are shown. (B) Ratios of polysome to monosome in indicated conditions. (C,D) Conceptual pie chart models interpreting how translational changes observed in yjl175w∆ mitigated growth defects upon GFP-op. These charts show the hypothetical allocations of ribosomes in indicated conditions, but their percentages are not based on the real data. See the main text for a detailed explanation of these charts.

