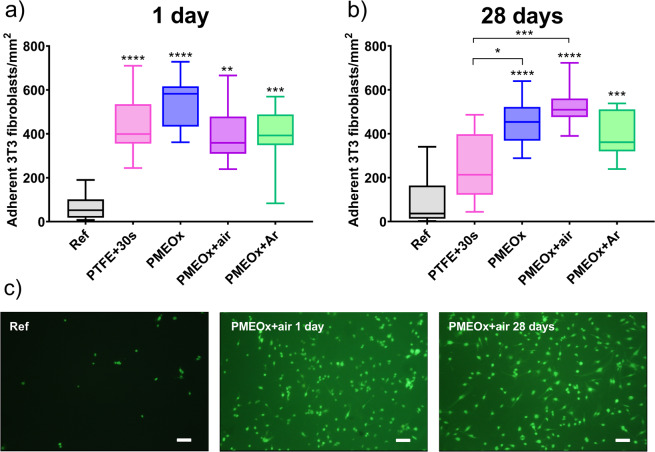
Figure 8.
Study of the adhesion of 3T3 fibroblasts on PTFE and on POx surfaces after 24 h incubation. (a) Density of adherent cells on selected samples (Ref - raw PTFE, PTFE + 30 s - PTFE after 30 s of air plasma treatment, PMEOx – without plasma post-treatment, PMEOx + air – plasma post-treatment in air, PMEOx + Ar – plasma post-treatment in argon) 1 day after preparation. The box represents the median values and interquartile ranges of the number of adherent cells per mm2, the whiskers represent minimal and maximal values. **p < 0.01, ***p < 0.001, ****p < 0.0001, compared to ref (b) Density of adherent cells on selected samples after 30 days of aging. *p < 0.05, ***p < 0.001, ****p < 0.0001, compared to ref or PTFE + 30 s, (c) Representative fluorescent images of adherent cells stained by green FDA. Scale bar = 50 μm.

