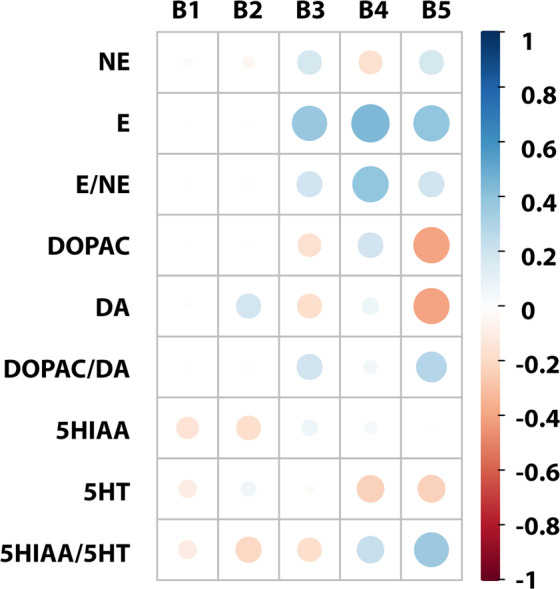
Figure 10.

Correlation matrix between cerebral IS concentrations and monoamines levels. The size of the circle and intensity of color represent the strength of the correlation (darker and larger circles demonstrate the strong correlation). Blue colors – positive correlations; red colors – negative correlations. B1 – cerebellum; B2 – brainstem; B3 – cerebral cortex; B4 – hypothalamus; B5 – striatum with hippocampus; NE – norepinephrine; E – epinephrine; E/NE – NE turnover; DA – dopamine; DOPAC – 3,4-dihydroxyphenylacetic acid; DOPAC/DA – DA turnover; 5HT – serotonin; 5HIAA – 5-hydroxyindolacetic acid; 5HIAA/5HT – 5HT turnover.
