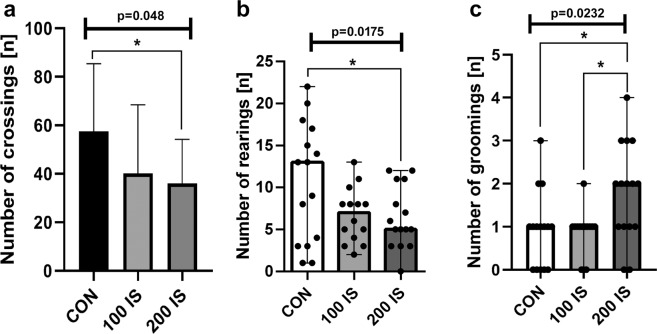
Figure 5.
The effect of IS on the number of crossings (a), rearings (b), and groomings (c) in the open field test; n = 44. (a) Data are presented as the mean ± SD due to passed normality test (alpha=0.05). Ordinary ANOVA test has been used to compare the data. Anova – 0.048 / F (DFn, DFd) = F (2, 42) = 3.225; Student t-test: *CON vs 200 IS P = 0.0181. (b) Data are presented as a median (full range) due to unmeet normal distribution condition (alpha = 0.05). Data were analyzed using Kruskal-Wallis test. Kruskal-Wallis test – 0.0175 / Kruskal-Wallis statistic 8.092; Mann-Whitney test: *CON vs 200 IS P = 0.048. (c) Data are presented as a median (full range) due to unmeet normal distribution condition (alpha = 0.05). Data were analyzed using Kruskal-Wallis test. Kruskal-Wallis test – 0.0232 / Kruskal-Wallis statistic 7.529; Mann-Whitney test: *CON vs 200 IS P = 0.0371; *100 IS vs 200 IS P = 0.0103. CON – control group; 100 IS – group receiving IS in the dose of 100 mg/kg b.w./day; 200 IS – group receiving IS in the dose of 200 mg/kg b.w./day.

