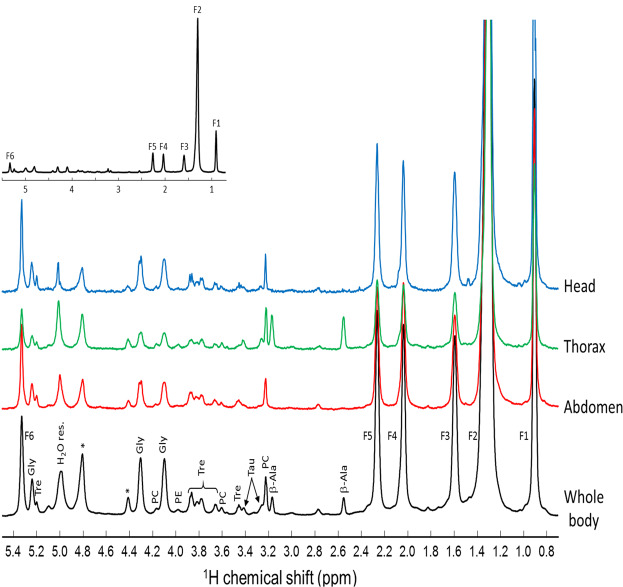
Figure 1.
Representative 1H HRMAS NMR spectra obtained by various integration of a 2D Chemical Shift Imaging (CSI) map of a control w1118 Drosophila female in the 0.8–5.4 ppm range. The black spectrum is obtained by integration over the full-body while the blue, green and red spectra result from the specific integration of the head, thorax and abdomen regions. The 2D CSI map was recorded at a magnetic field of 17.6 T with a spinning frequency of 2630 Hz. F1, F2, F3, F4, F5, F6 correspond to fatty acid resonances of CH3, (CH2)n, CH2C-C=O, CH2C=, CH2C=O, and CH=CH, respectively. β-Ala: β-alanine; PC: phosphocholine; Tau: taurine; Tre: trehalose; PE: phosphoethanolamine; Gly: glycerol; *: spinning sidebands.

