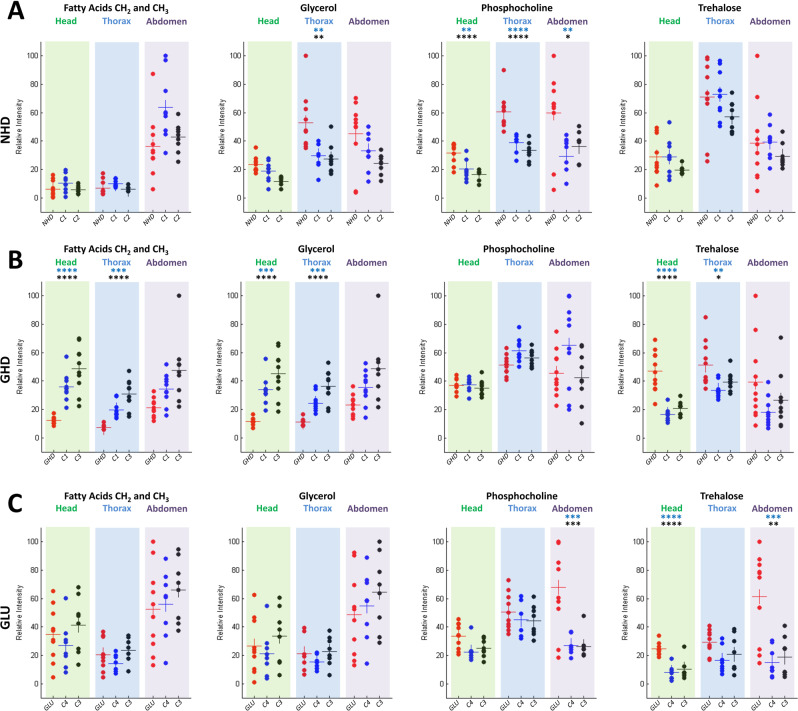
Figure 2.
Comparison of relative metabolite concentrations in the head, thorax, and abdomen for the NHD (A), GHD (B) and GLU (C) neurodegenerative models. Each point represents the normalized quantity of a metabolite in a single fly. The NHD, GHD or GLU Drosophila are shown in red dots, the UAS/+ (UAS-Httex1p-Q93 (C1) and UAS-Eaat1-IR (C4)) and Gal4/+ (elav-Gal4 (C2) and Eaat1-Gal4 (C3)) controls in blue and black dots, respectively. The horizontal bars indicate the mean metabolite quantity for each fly genotype. Stars above the graphs indicate p values of Tukey-Kramer tests when NHD, GHD or GLU flies were statistically different from the Gal4 (black stars) and UAS (blue stars) controls. ****p < 0.0001, ***p < 0.001, **p < 0.01 and *p < 0.05.

