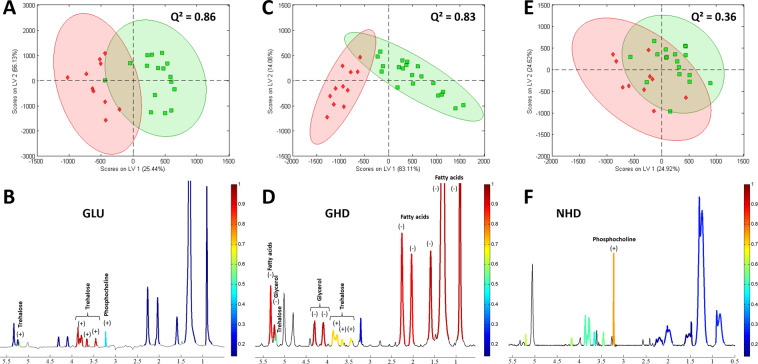
Figure 3.
PLS-DA on the main 1H resonances localized in fly head. (A,C,E) PLS-DA score plots derived from localized 1D 1H MAS NMR spectra of Drosophila heads. Green solid squares: control flies; red solid diamonds: GLU (A), GHD (C) or NHD (E) flies. The first and second Latent Variables are denoted LV1 and LV2, respectively. Each point represents a single fly. 95% confidence ellipses were drawn. A clear separation is revealed across the LV1 components of control flies and GLU or GHD, but not NHD flies. (B,D,F) Mean spectra derived from the whole series of 1D spectra localized in fly head for GLU (B), GHD (D) or NHD (F) flies. The colored parts show the integrated areas. The color scales indicate the Q² values obtained with the first latent variable of the PLS-DA analysis, red corresponding to the highest significance and blue to no significance. Positive (+) and negative (−) signs indicate an increase or a decrease in metabolite concentrations in the GLU, GHD or NHD expressing groups compared to controls, respectively.

