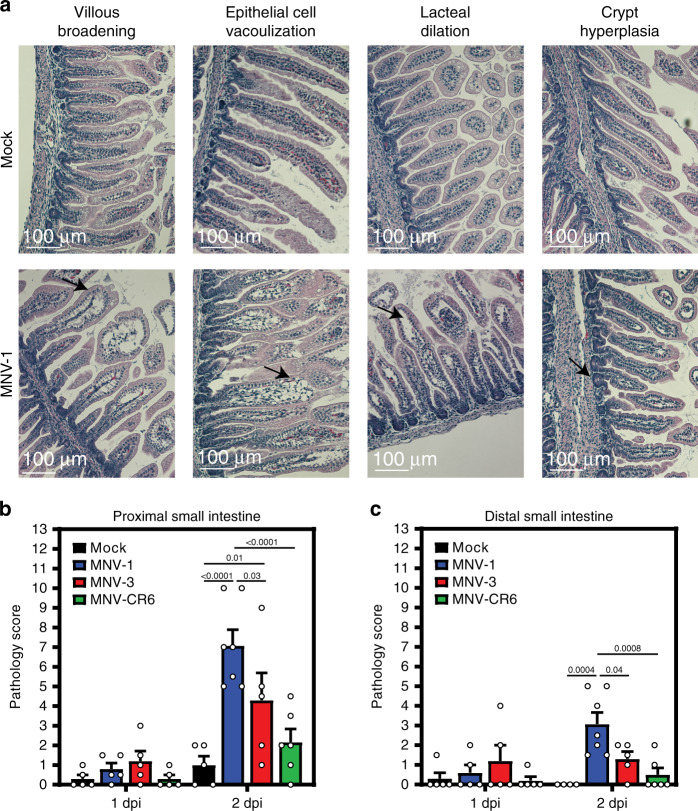
Fig. 3. Neonatal mice infected with MNV-1 show pathological changes.
Small intestinal sections collected from neonates infected with 108 TCID50 units of MNV-1 (blue), MNV-3 (red), MNV-CR6 (green), or mock (black) inoculum at 1 dpi (n = 5 for mock, n = 5 for MNV-1, n = 5 for MNV-3, n = 5 for MNV-CR6) and 2 dpi (n = 5 for mock, n = 7 for MNV-1, n = 5 for MNV-3, n = 6 for MNV-CR6) were stained with hematoxylin and eosin. Representative images of notable pathology are shown (a). Sections were scored blindly by an animal veterinarian for pathological changes in the proximal small intestine (b) and distal small intestine (c). Scale bars denote 100 µm. Error bars denote standard errors of mean in all figures. P values were determined using two-way ANOVA with corrections for multiple comparisons. Source data are provided as a Source data file.

