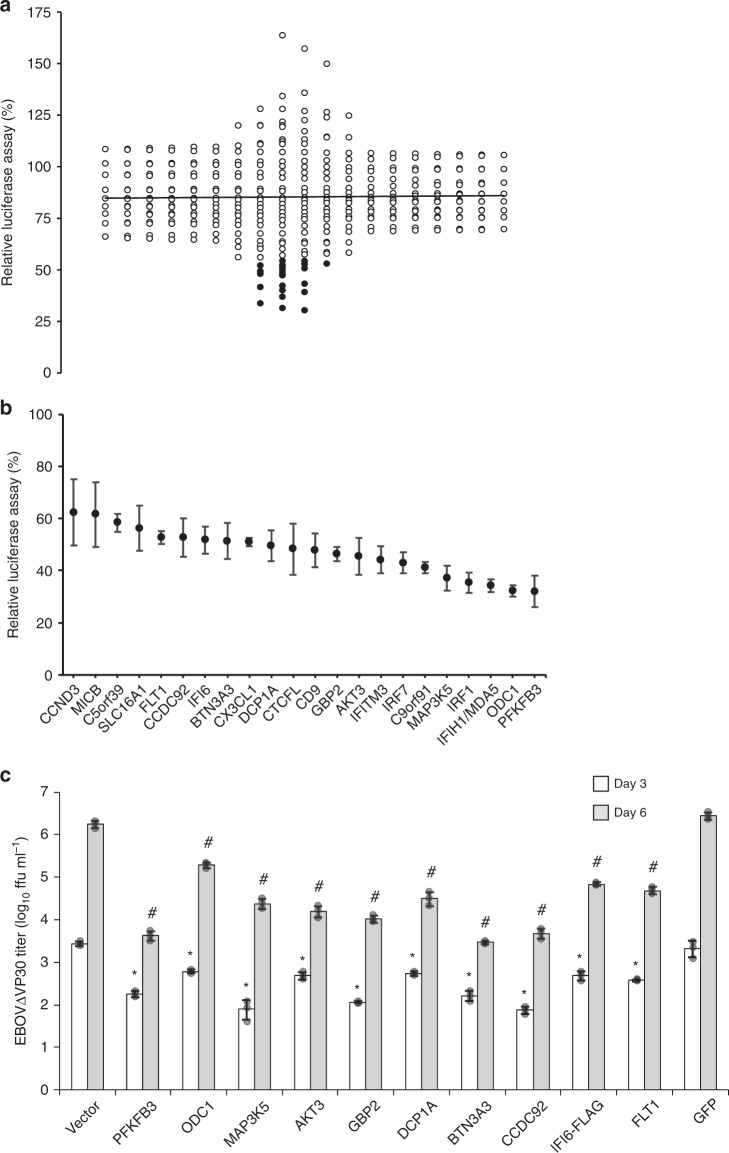
Fig. 1. Identification of ISGs that attenuate EBOV-driven luciferase activity and EBOV growth kinetics.
a Dot plot of EBOV-driven luciferase activity in the presence of overexpressed ISGs. HEK-293T VP30 cells were transfected with expression vectors for each ISG for 24 h prior to infection with EBOV∆VP30-luc at an MOI of 1.0. Virus-driven Renilla luciferase activity was measured 48 h post infection and compared with the luciferase activity of infected, control cells that were transfected with a vector expressing only a red fluorescent protein. The black line indicates the ISG population mean, and black filled-in dots represent the top 22 ISGs with significant anti-EBOV activities, which were evaluated further. b Confirmation assays with EBOV∆VP30-luc infection of transfected HEK-293T VP30 cells with the top 22 ISGs with anti-EBOV activity from the primary screen. Data are presented as means ± standard deviation (SD), and are representative of three independent experiments. The expression of each of the top 10 ISGs selected for further characterization under this screening condition was confirmed by western blotting (Supplementary Fig. 20). c Titers of EBOV∆VP30-GFP from HEK-293T VP30 cells after overexpression of selected ISGs cloned into the protein expression vector pCAGGS. Cells were transfected with expression vectors for each ISG or control vectors for 24 h prior to infection with EBOV∆VP30-GFP at an MOI of 0.0001. Virus titers were then measured on days 3 and 6 post infection. Data are presented as means ± SD, and are representative of three independent experiments. (*) indicates a statistically significant difference (p-value ≤ 0.05) from the day 3 controls; (#) indicates a statistically significant difference (p-value ≤ 0.05) from the day 6 controls. Source data are provided as a Source Data file.

