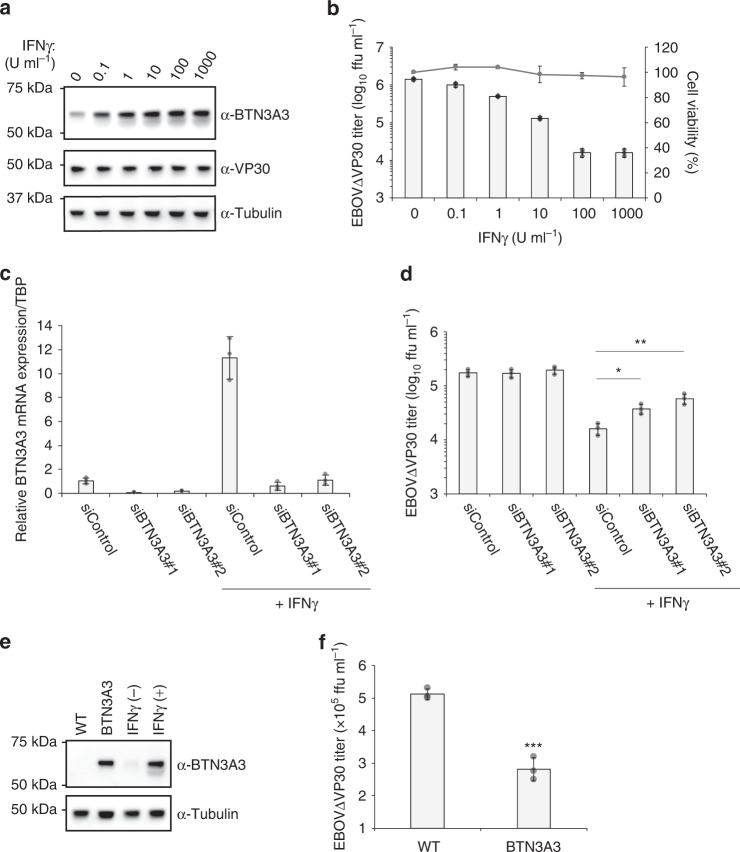
Fig. 2. EBOV attenuation by endogenous BTN3A3.
a BTN3A3 expression in HeLa VP30 cells treated with the increasing doses of IFNγ for 24 h. Cells were lysed and the indicated protein expression levels were analyzed by immunoblotting. Data are representative of two independent experiments. b Titers of EBOV∆VP30 from HeLa VP30 cells treated with the increasing doses of IFNγ for 24 h prior to infection at an MOI of 0.01. Virus titer was measured on day 2 post infection. In a separate set of experiments, cell viability of IFNγ-treated cells was measured on day 3 post-treatment by using a cell proliferation assay. Data are presented as means ± SD, and are representative of three independent experiments. c Relative BTN3A3 mRNA expression in HeLa VP30 cells under BTN3A3 knockdown. Cells were transfected with BTN3A3 siRNAs or control siRNA and then at 48 h post transfection, were treated with 10 U ml−1 of IFNγ for 24 h. RNA was quantified by use of qRT-PCR. Data are representative of two independent experiments performed in triplicate and are presented as means ± SD of technical triplicates. d Cells were transfected with siRNA and then treated with IFNγ as described in c. At 24 h post-IFNγ treatment, cells were infected with EBOV∆VP30 at an MOI of 0.01. Virus titer was measured on day 2 post infection. Data are presented as means ± SD, and are representative of three independent experiments. (*) indicates a statistically significant difference (p-values of two-tailed Student’s t-tests; *p < 0.05, **p < 0.01) from the control. e BTN3A3 expression in HeLa VP30 cells that stably express BTN3A3 and Hela VP30 cells treated with or without IFNγ (10 U ml−1 for 24 h). Cells were lysed and the indicated protein expression levels were analyzed by immunoblotting. Data are representative of two independent experiments. f Titers of EBOV∆VP30 from HeLa VP30/BTN3A3 cells infected with EBOV∆VP30 at an MOI of 0.001. Virus titer was measured on day 3 post infection. Data are presented as means ± SD, and are representative of three independent experiments. (*) indicates a statistically significant difference (p-values two-tailed Student’s t-tests; ***p = 0.00051) from the control. Source data are provided as a Source Data file.

