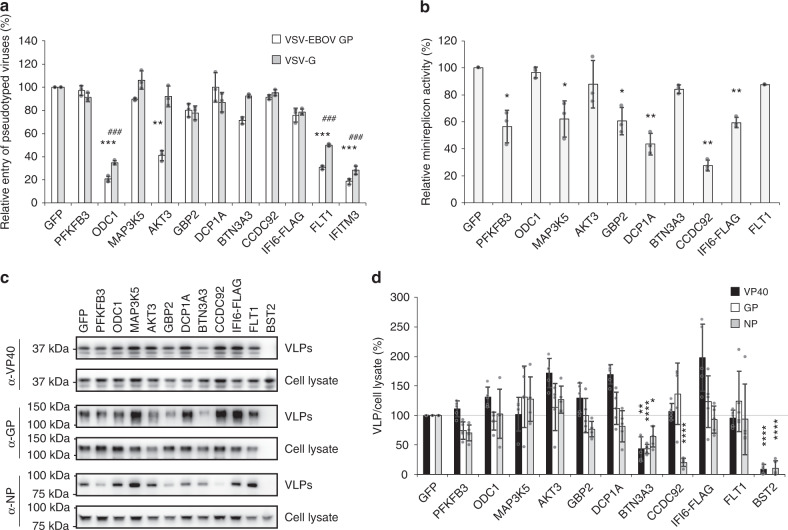
Fig. 3. Effect of selected ISGs on EBOV cell entry, transcription/replication, and virion formation/budding.
a Relative luciferase activity in HEK-293T cells after transfection for 24 h with each of the selected ISGs and infection with VSV-EBOV GP virus (black bars) or VSV-G (gray bars) at an MOI of 0.5. IFITM3 served as a positive control for inhibition of virus entry. Data are presented as means ± SD, and are representative of three independent experiments. (*) indicates a statistically significant difference (p-values of two-tailed Student’s t-tests; **p < 0.01, ***p < 0.001) for VSV-EBOV GP compared with the negative control; (#) indicates a statistically significant difference (p-values of two-tailed Student’s t-tests; ###p < 0.001) for VSV-G virus compared with the negative control. b Relative luciferase activity in HEK-293T VP30/L cells after transfection for 48 h with vectors encoding the remaining minireplicon components, each of the 10 selected ISGs, and an internal Renilla luciferase control vector. Data are presented as means ± SD, and are representative of three independent experiments. (*) indicates a statistically significant difference (p-values of two-tailed Student’s t-tests; *p < 0.05, **p < 0.01) from the control. c, d Representative western blot showing expression of EBOV VP40, GP, and NP in VLPs and cell lysate from transfected HEK-293T cells (c). The ISG BST2/tetherin, a known inhibitor of VP40-driven VLP formation, was overexpressed with VP40 alone as a positive control. Data are representative of five independent experiments. Quantification analysis of the viral proteins (VP40, GP, and NP) in VLPs following ISG overexpression compared with the GFP control was performed using ImageJ software (d). The ratio of the band intensity in the VLP to that in the cell lysate is indicated as a percentage. Data are presented as the mean ± SD (n = 5). (*) indicates a statistically significant difference (p-values of two-tailed Student’s t-tests; *p < 0.05, **p < 0.01, ****p < 0.0001) from each of the GFP controls. Source data are provided as a Source Data file.

