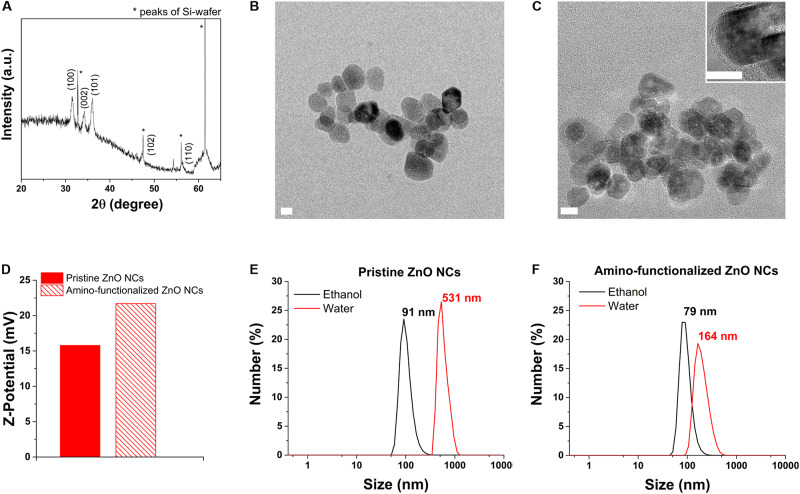
FIGURE 1.
ZnO NCs characterization. (A) XRD analysis. (B) HRTEM of pristine ZnO NCs and (C) amino-functionalized ZnO NCs, scale bar = 10 nm. The inset in C represents a higher magnification image of amino-functionalized ZnO NCs. (D) Z-potential of pristine and amino-functionalized ZnO NCs. DLS measurements of (E) pristine and (F) amino-functionalized ZnO NCs both in ethanol (black curve) and dd water (red curve).

