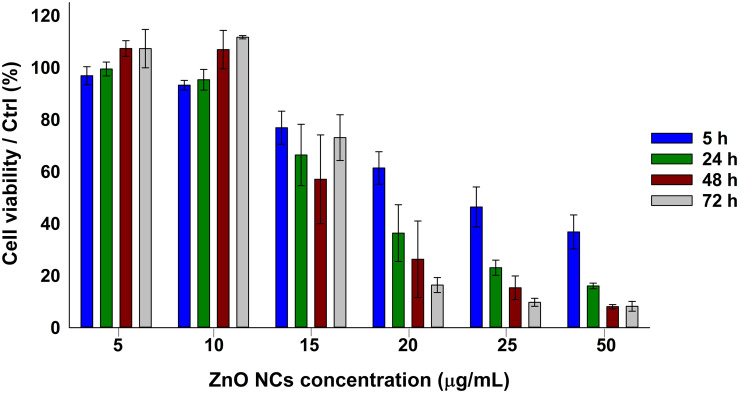
FIGURE 2.
ZnO NCs cytotoxicity on KB cells at different time points detected with the WST-1 assay. KB cells were incubated with different ZnO NCs concentrations (5, 10, 15, 20, 25, and 50 μg/mL). Cell viability was measured after 5, 24, 48, and 72 h. Bars represent mean ± SEM percentages of cell viability with respect to the control cells, n = 3.

