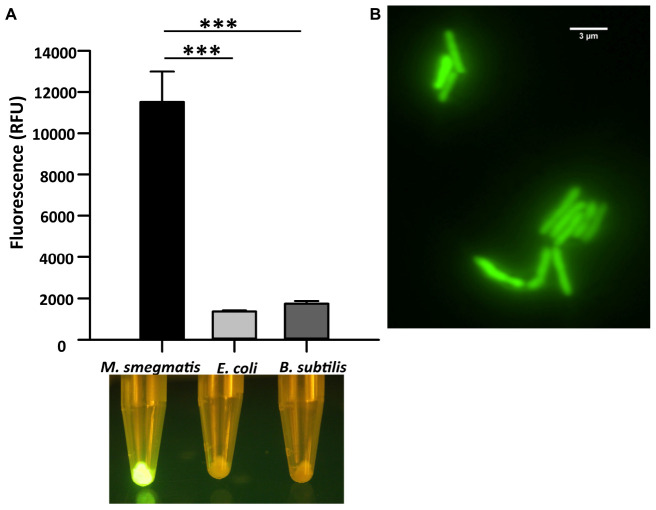
FIGURE 1.
Cell binding assay of CTD-GFP with different bacterial cells. (A) The relative fluorescence obtained for CTD-GFP bound to M. smegmatis, E. coli, and B. subtilis cells. Fluorescence was measured by keeping the excitation and emission wavelengths at 488 and 509 nm, respectively. The data represent an average of three experiments with error bars denoting the standard deviation (p-value analysis: ∗∗∗, < 0.0003). The bottom panel shows the image of fluorescing cell pellet obtained after illuminating it with a blue light (∼470 nm) source. (B) Fluorescence microscopy imaging of CTD-GFP bound M. smegmatis cells. The image was taken on a Leica Microsystems fluorescence microscope with a GFP filter.

