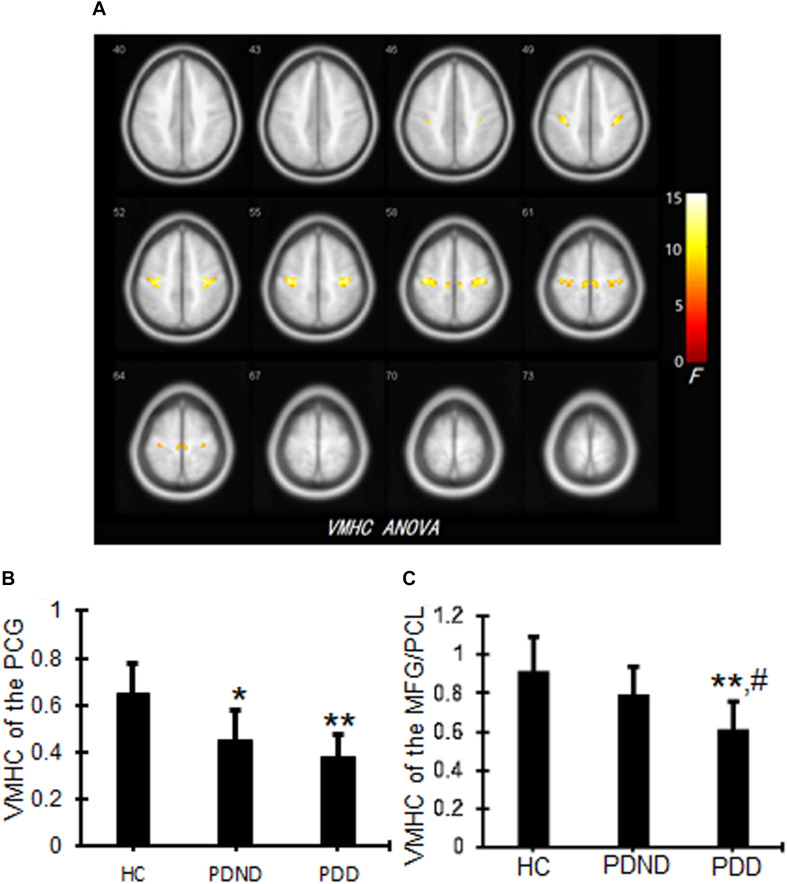
FIGURE 1.
VMHC differences among PDD, PDND, and HC groups. The ANCOVA thresholds were set at a voxel-level p < 0.01, cluster size >15 voxels, corresponding to a corrected p < 0.05 as determined by AlphaSim correction. (A) Representative images. The yellow/red color bar indicates the F value from the ANCOVAs. (B) VMHC values of the PCG. *p < 0.05, **p < 0.01 vs. HC. (C) VMHC values of the MFG/PCL. Bar plots representing the mean VMHC values (and standard deviation) between three groups. **p < 0.01 vs. HC, #p < 0.05 vs. PDND. VMHC, voxel-mirrored homotopic connectivity; PDD, Parkinson’s disease with depression; PDND, Parkinson’s disease without depression; HC, healthy control; ANCOVA, analysis of covariance; PCG, precentral gyrus; PCL, paracentral lobule.

